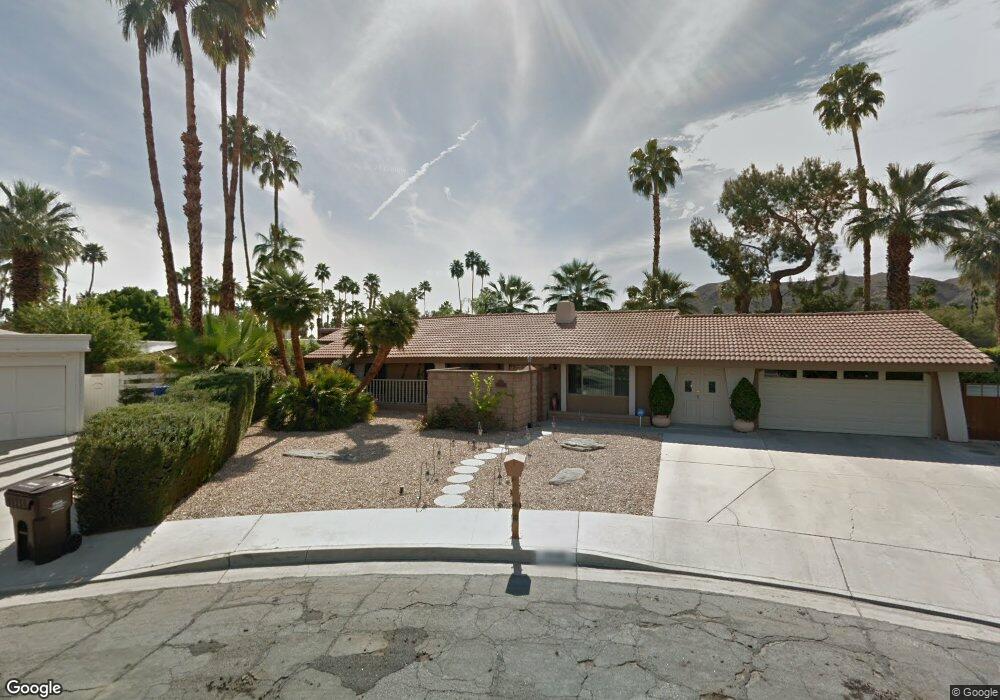
1540 S Inca Cir Palm Springs, CA 92264
Los Compadres NeighborhoodEstimated Value: $937,242 - $1,163,000
4
Beds
2
Baths
1,972
Sq Ft
$535/Sq Ft
Est. Value
About This Home
This home is located at 1540 S Inca Cir, Palm Springs, CA 92264 and is currently estimated at $1,054,061, approximately $534 per square foot. 1540 S Inca Cir is a home located in Riverside County with nearby schools including Cahuilla Elementary School, Raymond Cree Middle School, and Palm Springs High School.
Ownership History
Date
Name
Owned For
Owner Type
Purchase Details
Closed on
Dec 30, 2021
Sold by
Gintz Thomas L and The Halbert Gintz Family Trust
Bought by
Gintz Thomas L and The Thomas L Gintz Living Trus
Current Estimated Value
Purchase Details
Closed on
Jul 7, 2015
Sold by
The Ronald J Halbert Living Trust
Bought by
The Halbert Gintz Family Trust
Purchase Details
Closed on
Mar 19, 1999
Sold by
Halbert Ronald J
Bought by
Ronald J Halbert Living Trust
Purchase Details
Closed on
Dec 29, 1997
Sold by
Stewart Raymond R and Stewart Christine
Bought by
Halbert Ronald J
Home Financials for this Owner
Home Financials are based on the most recent Mortgage that was taken out on this home.
Original Mortgage
$40,000
Interest Rate
7.05%
Mortgage Type
Purchase Money Mortgage
Create a Home Valuation Report for This Property
The Home Valuation Report is an in-depth analysis detailing your home's value as well as a comparison with similar homes in the area
Home Values in the Area
Average Home Value in this Area
Purchase History
| Date | Buyer | Sale Price | Title Company |
|---|---|---|---|
| Gintz Thomas L | -- | None Available | |
| The Halbert Gintz Family Trust | -- | None Available | |
| Ronald J Halbert Living Trust | -- | -- | |
| Halbert Ronald J | $161,000 | First American Title Ins Co |
Source: Public Records
Mortgage History
| Date | Status | Borrower | Loan Amount |
|---|---|---|---|
| Previous Owner | Halbert Ronald J | $40,000 |
Source: Public Records
Tax History Compared to Growth
Tax History
| Year | Tax Paid | Tax Assessment Tax Assessment Total Assessment is a certain percentage of the fair market value that is determined by local assessors to be the total taxable value of land and additions on the property. | Land | Improvement |
|---|---|---|---|---|
| 2025 | $3,823 | $305,385 | $63,849 | $241,536 |
| 2023 | $3,823 | $293,528 | $61,371 | $232,157 |
| 2022 | $3,893 | $287,773 | $60,168 | $227,605 |
| 2021 | $3,816 | $282,132 | $58,989 | $223,143 |
| 2020 | $3,651 | $279,240 | $58,385 | $220,855 |
| 2019 | $3,589 | $273,766 | $57,241 | $216,525 |
| 2018 | $3,522 | $268,399 | $56,120 | $212,279 |
| 2017 | $3,470 | $263,137 | $55,020 | $208,117 |
| 2016 | $3,370 | $257,979 | $53,942 | $204,037 |
| 2015 | $3,227 | $254,102 | $53,131 | $200,971 |
| 2014 | $3,177 | $249,127 | $52,092 | $197,035 |
Source: Public Records
Map
Nearby Homes
- 2989 E Sonora Rd
- 2994 Guadalupe Rd
- 1592 S Compadre Rd
- 2964 E Orella Cir
- 1240 S Beverly Dr
- 2950 E Escoba Dr
- 2795 Alondra Way
- 2701 E Mesquite Ave Unit Z136
- 2701 E Mesquite Ave Unit T92
- 1334 S San Joaquin Dr
- 1321 Crystal Ct
- 2365 S Oakcrest Dr
- 1177 S Farrell Dr
- 1768 S Araby Dr
- 1772 S Araby Dr
- 2455 Via Sonoma Unit F
- 1833 S Araby Dr Unit 32
- 2454 E Palm Canyon Dr Unit 1A
- 2424 E Palm Canyon Dr Unit 2D
- 2371 Via Sonoma Unit B
- 2976 Guadalupe Rd
- 1522 S Inca Cir
- 1543 S Beverly Dr
- 1545 S Inca Cir
- 2958 Guadalupe Rd
- 1511 S Beverly Dr
- 1519 S Inca Cir
- 2977 Guadalupe Rd
- 2961 Guadalupe Rd
- 2978 E Vera Cruz Rd
- 1550 S La Brea Rd
- 2932 Guadalupe Rd
- 2966 E Vera Cruz Rd
- 2993 Guadalupe Rd
- 1518 S La Brea Rd
- 2990 E Vera Cruz Rd
- 1500 S Beverly Dr
- 1520 S Beverly Dr
- 2944 E Vera Cruz Rd
- 1460 S Beverly Dr