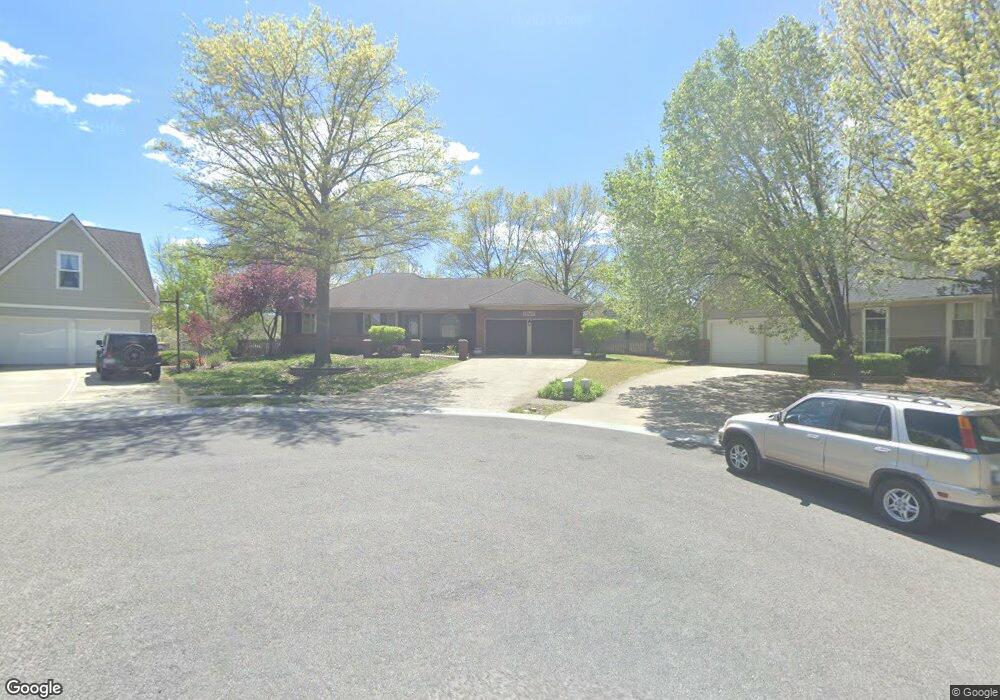
15407 W 79th Terrace Lenexa, KS 66219
Estimated Value: $371,000 - $427,000
3
Beds
3
Baths
1,496
Sq Ft
$264/Sq Ft
Est. Value
About This Home
This home is located at 15407 W 79th Terrace, Lenexa, KS 66219 and is currently estimated at $395,590, approximately $264 per square foot. 15407 W 79th Terrace is a home located in Johnson County with nearby schools including Christa McAuliffe Elementary School, Westridge Middle School, and Shawnee Mission West High School.
Ownership History
Date
Name
Owned For
Owner Type
Purchase Details
Closed on
Dec 8, 2014
Sold by
Coyle James A and Coyle Suzanne J
Bought by
Coyle Danielle J and Coyle Suzanne J
Current Estimated Value
Home Financials for this Owner
Home Financials are based on the most recent Mortgage that was taken out on this home.
Original Mortgage
$168,000
Outstanding Balance
$123,518
Interest Rate
2.87%
Mortgage Type
Adjustable Rate Mortgage/ARM
Estimated Equity
$272,072
Purchase Details
Closed on
Nov 4, 2013
Sold by
The Dry Living Trust
Bought by
Dac Ventures Llc
Home Financials for this Owner
Home Financials are based on the most recent Mortgage that was taken out on this home.
Original Mortgage
$170,000
Interest Rate
4.28%
Mortgage Type
Future Advance Clause Open End Mortgage
Purchase Details
Closed on
Oct 2, 2002
Sold by
Seichepine Roy
Bought by
Dry Thomas J and Dry Marilyn D
Home Financials for this Owner
Home Financials are based on the most recent Mortgage that was taken out on this home.
Original Mortgage
$86,000
Interest Rate
6.2%
Create a Home Valuation Report for This Property
The Home Valuation Report is an in-depth analysis detailing your home's value as well as a comparison with similar homes in the area
Home Values in the Area
Average Home Value in this Area
Purchase History
| Date | Buyer | Sale Price | Title Company |
|---|---|---|---|
| Coyle Danielle J | -- | First American Title | |
| Dac Ventures Llc | -- | First American Title | |
| Dry Thomas J | -- | Chicago Title Insurance Co |
Source: Public Records
Mortgage History
| Date | Status | Borrower | Loan Amount |
|---|---|---|---|
| Open | Coyle Danielle J | $168,000 | |
| Closed | Dac Ventures Llc | $170,000 | |
| Previous Owner | Dry Thomas J | $86,000 |
Source: Public Records
Tax History Compared to Growth
Tax History
| Year | Tax Paid | Tax Assessment Tax Assessment Total Assessment is a certain percentage of the fair market value that is determined by local assessors to be the total taxable value of land and additions on the property. | Land | Improvement |
|---|---|---|---|---|
| 2024 | $4,771 | $43,148 | $9,417 | $33,731 |
| 2023 | $4,391 | $38,996 | $7,853 | $31,143 |
| 2022 | $4,124 | $36,593 | $7,135 | $29,458 |
| 2021 | $4,124 | $31,809 | $6,557 | $25,252 |
| 2020 | $3,653 | $30,406 | $6,557 | $23,849 |
| 2019 | $3,545 | $29,486 | $5,465 | $24,021 |
| 2018 | $3,366 | $27,727 | $5,465 | $22,262 |
| 2017 | $3,211 | $25,622 | $4,746 | $20,876 |
| 2016 | $3,249 | $25,622 | $4,522 | $21,100 |
| 2015 | $3,159 | $25,082 | $4,522 | $20,560 |
| 2013 | -- | $21,770 | $4,522 | $17,248 |
Source: Public Records
Map
Nearby Homes
- 8033 Hall St
- 15615 W 81st St
- 15322 W 83rd St
- 15322 W 83rd Terrace
- 15529 W 83rd Terrace
- 14828 W 83rd Place
- 8403 Swarner Dr
- 14915 W 84th Terrace
- 15710 W 84th Terrace
- 7621 Lichtenauer Dr
- 14620 W 84th St
- 7219 Allman Rd
- 7239 Allman Rd
- 7221 Allman Rd
- 7237 Allman Rd
- 7231 Allman Rd
- 8616 Baska Ct
- 15611 W 86th St
- 14424 W 84th Terrace
- 7229 Allman Dr
- 15411 W 79th Terrace
- 15403 W 79th Terrace
- 15412 W 80th St
- 15406 W 80th St
- 7925 Hall St
- 15418 W 80th St
- 7919 Hall St
- 7931 Hall St
- 15400 W 80th St
- 15325 W 79th Terrace
- 7913 Hall St
- 15412 W 79th Terrace
- 7937 Hall St
- 15320 W 80th St
- 15408 W 79th Terrace
- 15319 W 79th Terrace
- 7907 Hall St
- 15404 W 79th Terrace
- 15314 W 80th St
- 15409 W 80th St