1541 Marion Rd Redlands, CA 92374
South Redlands NeighborhoodEstimated Value: $966,000 - $1,814,808
4
Beds
3
Baths
2,573
Sq Ft
$570/Sq Ft
Est. Value
About This Home
This home is located at 1541 Marion Rd, Redlands, CA 92374 and is currently estimated at $1,466,452, approximately $569 per square foot. 1541 Marion Rd is a home located in San Bernardino County with nearby schools including Mariposa Elementary School, Moore Middle School, and Redlands East Valley High School.
Ownership History
Date
Name
Owned For
Owner Type
Purchase Details
Closed on
Apr 20, 2007
Sold by
Andreasen Troy J and Andreasen Demeree A
Bought by
Andreasen Troy J and Andreasen Demeree A
Current Estimated Value
Home Financials for this Owner
Home Financials are based on the most recent Mortgage that was taken out on this home.
Original Mortgage
$1,425,000
Interest Rate
6.15%
Mortgage Type
Construction
Purchase Details
Closed on
Dec 6, 2004
Sold by
Andreasen Troy J and Andreasen Demeree D
Bought by
Andreasen Troy J and Andreasen Demeree A
Purchase Details
Closed on
Nov 12, 2002
Sold by
Richmond James
Bought by
Andreasen Troy J and Andreasen Demeree D
Home Financials for this Owner
Home Financials are based on the most recent Mortgage that was taken out on this home.
Original Mortgage
$510,400
Interest Rate
6.06%
Purchase Details
Closed on
Jun 10, 2002
Sold by
Richmond James
Bought by
Richmond James
Purchase Details
Closed on
Feb 21, 1995
Sold by
Richmond Ralph W and Richmond Luella M
Bought by
Richmond Ralph W and Richmond Luella M
Create a Home Valuation Report for This Property
The Home Valuation Report is an in-depth analysis detailing your home's value as well as a comparison with similar homes in the area
Home Values in the Area
Average Home Value in this Area
Purchase History
| Date | Buyer | Sale Price | Title Company |
|---|---|---|---|
| Andreasen Troy J | -- | Accommodation | |
| Andreasen Troy J | -- | United Title | |
| Andreasen Troy J | -- | -- | |
| Andreasen Troy J | $638,000 | Chicago Title Co | |
| Richmond James | -- | -- | |
| Richmond Ralph W | -- | -- |
Source: Public Records
Mortgage History
| Date | Status | Borrower | Loan Amount |
|---|---|---|---|
| Closed | Andreasen Troy J | $1,425,000 | |
| Closed | Andreasen Troy J | $510,400 |
Source: Public Records
Tax History
| Year | Tax Paid | Tax Assessment Tax Assessment Total Assessment is a certain percentage of the fair market value that is determined by local assessors to be the total taxable value of land and additions on the property. | Land | Improvement |
|---|---|---|---|---|
| 2025 | $14,546 | $1,181,829 | $344,705 | $837,124 |
| 2024 | $13,574 | $1,158,656 | $337,946 | $820,710 |
| 2023 | $13,557 | $1,135,938 | $331,320 | $804,618 |
| 2022 | $13,358 | $1,113,665 | $324,824 | $788,841 |
| 2021 | $13,602 | $1,091,829 | $318,455 | $773,374 |
| 2020 | $13,397 | $1,080,634 | $315,190 | $765,444 |
| 2019 | $13,018 | $1,059,445 | $309,010 | $750,435 |
| 2018 | $12,690 | $1,038,672 | $302,951 | $735,721 |
| 2017 | $12,581 | $1,018,306 | $297,011 | $721,295 |
| 2016 | $12,436 | $998,339 | $291,187 | $707,152 |
| 2015 | $12,343 | $983,343 | $286,813 | $696,530 |
| 2014 | $12,116 | $964,081 | $281,195 | $682,886 |
Source: Public Records
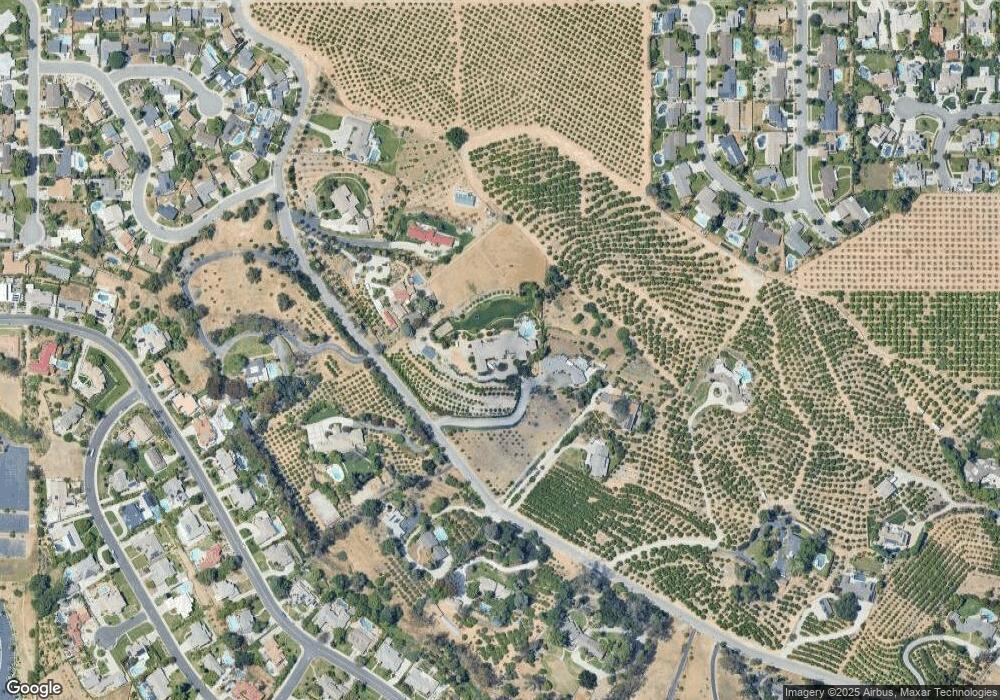
Map
Nearby Homes
- 1550 Marion Rd
- 1410 Pleasantview Dr
- 1472 Moore St
- 1442 Moore St
- 1458 Moore St
- 1452 Moore St
- 1479 Moore St
- 1454 E Highland Ave
- 61 Sparrow Ct
- 743 Buckingham Dr
- 56 Dearborn Cir
- 1388 Brandon Ct
- 1562 E Citrus Ave
- 225 Sunset Dr
- 1370 Oak St
- 1592 Christopher Ln
- 1049 Evergreen Ct
- 356 Campbell Ave
- 707 S Wabash Ave
- 1665 Wabash Ave
- 1545 Marion Rd
- 1533 Marion Rd
- 1559 Marion Rd
- 1561 Marion Rd
- 1525 Marion Rd
- 1540 Marion Rd
- 1552 Marion Rd
- 0 Marion Rd Unit IG16000908
- 1517 Marion Rd
- 1595 Marion Rd
- 420 Wilbar Cir
- 424 Wilbar Cir
- 1520 Marion Rd
- 1560 Marion Rd
- 1509 Marion Rd
- 428 Wilbar Cir
- 416 Wilbar Cir
- 432 Wilbar Cir
- 412 Wilbar Cir
- 1461 Crestview Rd
Your Personal Tour Guide
Ask me questions while you tour the home.