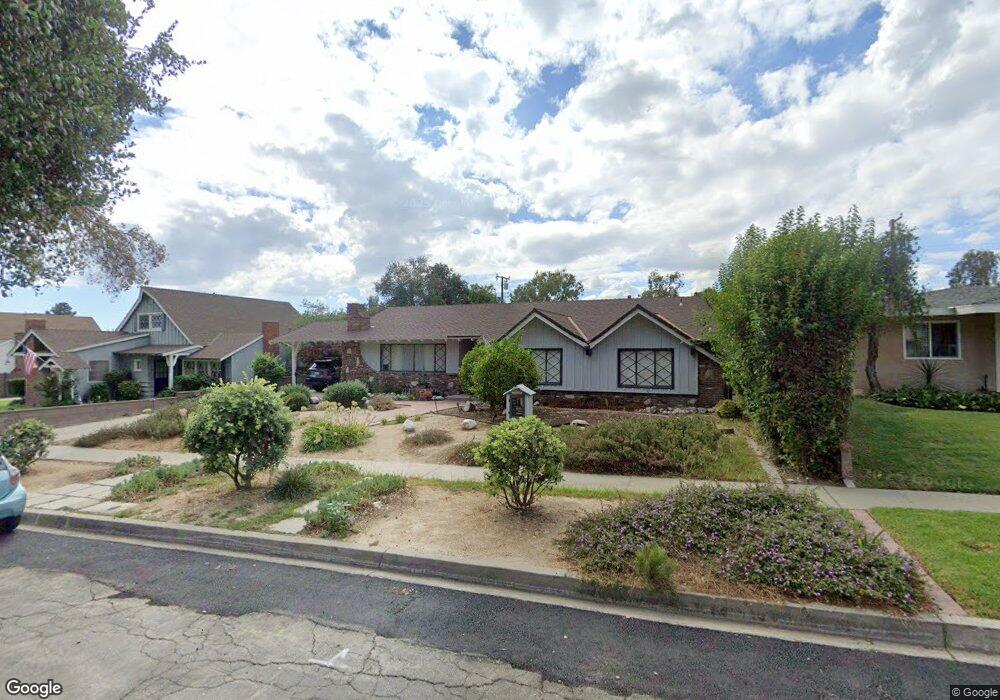
1541 N Laurel Ave Upland, CA 91786
Estimated Value: $859,000 - $923,000
3
Beds
2
Baths
1,811
Sq Ft
$492/Sq Ft
Est. Value
About This Home
This home is located at 1541 N Laurel Ave, Upland, CA 91786 and is currently estimated at $890,608, approximately $491 per square foot. 1541 N Laurel Ave is a home located in San Bernardino County with nearby schools including Magnolia Elementary, Pioneer Junior High School, and Upland High School.
Ownership History
Date
Name
Owned For
Owner Type
Purchase Details
Closed on
Jan 12, 2009
Sold by
Peck Christopher and Peck Victoria
Bought by
Peck Christopher
Current Estimated Value
Home Financials for this Owner
Home Financials are based on the most recent Mortgage that was taken out on this home.
Original Mortgage
$344,000
Outstanding Balance
$221,011
Interest Rate
5.49%
Mortgage Type
New Conventional
Estimated Equity
$669,597
Purchase Details
Closed on
Sep 4, 2003
Sold by
Czuczko Nicholas and Czuczko Gail Ann
Bought by
Peck Christopher
Home Financials for this Owner
Home Financials are based on the most recent Mortgage that was taken out on this home.
Original Mortgage
$300,000
Interest Rate
6.22%
Mortgage Type
Purchase Money Mortgage
Create a Home Valuation Report for This Property
The Home Valuation Report is an in-depth analysis detailing your home's value as well as a comparison with similar homes in the area
Home Values in the Area
Average Home Value in this Area
Purchase History
| Date | Buyer | Sale Price | Title Company |
|---|---|---|---|
| Peck Christopher | -- | Lawyers Title | |
| Peck Christopher | $412,500 | Fidelity National Title |
Source: Public Records
Mortgage History
| Date | Status | Borrower | Loan Amount |
|---|---|---|---|
| Open | Peck Christopher | $344,000 | |
| Closed | Peck Christopher | $300,000 |
Source: Public Records
Tax History Compared to Growth
Tax History
| Year | Tax Paid | Tax Assessment Tax Assessment Total Assessment is a certain percentage of the fair market value that is determined by local assessors to be the total taxable value of land and additions on the property. | Land | Improvement |
|---|---|---|---|---|
| 2025 | $6,294 | $586,493 | $205,273 | $381,220 |
| 2024 | $6,294 | $574,993 | $201,248 | $373,745 |
| 2023 | $6,200 | $563,719 | $197,302 | $366,417 |
| 2022 | $6,067 | $552,665 | $193,433 | $359,232 |
| 2021 | $6,061 | $541,828 | $189,640 | $352,188 |
| 2020 | $5,896 | $536,272 | $187,695 | $348,577 |
| 2019 | $5,876 | $525,757 | $184,015 | $341,742 |
| 2018 | $5,733 | $515,448 | $180,407 | $335,041 |
| 2017 | $5,568 | $505,342 | $176,870 | $328,472 |
| 2016 | $5,343 | $495,433 | $173,402 | $322,031 |
| 2015 | $5,222 | $487,991 | $170,797 | $317,194 |
| 2014 | $5,087 | $478,432 | $167,451 | $310,981 |
Source: Public Records
Map
Nearby Homes
- 388 Harford Place
- 1604 N Laurel Ave
- 1629 N Palm Ave
- 1404 N Euclid Ave
- 1623 N Vallejo Way
- 1346 N Euclid Ave
- 1477 Winston Ct
- 1754 N Tulare Way
- 256 W 18th St
- 882 W 17th St
- 1234 N Laurel Ave
- 1377 N 5th Ave
- 655 Doreen Ct
- 1018 W 15th St
- 1547 Shamrock Ave
- 728 Pebble Beach Dr
- 1817 N Vallejo Way
- 1844 N 1st Ave
- 1099 Sullivan St
- 1788 N Coolcrest Ave
- 1547 N Laurel Ave
- 1537 N Laurel Ave
- 1540 Columbine Way
- 1534 Columbine Way
- 1553 N Laurel Ave
- 1531 N Laurel Ave
- 1528 Columbine Way
- 1540 N Laurel Ave
- 1548 N Laurel Ave
- 1552 Columbine Way
- 124 Gardenia Ct
- 1536 N Laurel Ave
- 1559 N Laurel Ave
- 1523 N Laurel Ave
- 1528 N Laurel Ave
- 1522 Columbine Way
- 1558 Columbine Way
- 131 Gardenia Ct
- 1565 N Laurel Ave
- 1515 N Laurel Ave