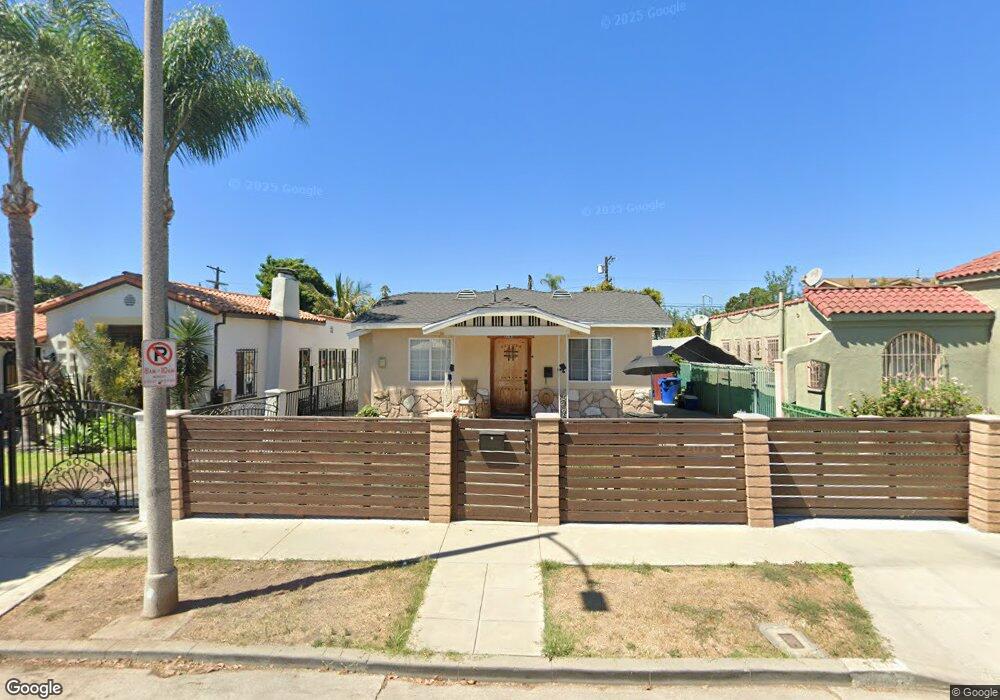
1541 S Dunsmuir Ave Los Angeles, CA 90019
Mid-City NeighborhoodEstimated Value: $971,000 - $1,079,000
3
Beds
2
Baths
1,024
Sq Ft
$1,015/Sq Ft
Est. Value
About This Home
This home is located at 1541 S Dunsmuir Ave, Los Angeles, CA 90019 and is currently estimated at $1,039,787, approximately $1,015 per square foot. 1541 S Dunsmuir Ave is a home located in Los Angeles County with nearby schools including Saturn Street Elementary School, Fairfax High School, and New Los Angeles Charter.
Ownership History
Date
Name
Owned For
Owner Type
Purchase Details
Closed on
Jan 30, 2004
Sold by
Sy Richard T
Bought by
Orteza Danes and Pineda Richelle
Current Estimated Value
Home Financials for this Owner
Home Financials are based on the most recent Mortgage that was taken out on this home.
Original Mortgage
$272,000
Outstanding Balance
$125,704
Interest Rate
5.62%
Mortgage Type
Purchase Money Mortgage
Estimated Equity
$914,083
Purchase Details
Closed on
Jan 29, 2000
Sold by
Sy Ricardo T
Bought by
Sy Richard T and Sy Elizabeth T
Purchase Details
Closed on
Oct 1, 1999
Sold by
Sy Elizabeth
Bought by
Sy Ricardo T
Home Financials for this Owner
Home Financials are based on the most recent Mortgage that was taken out on this home.
Original Mortgage
$123,100
Interest Rate
7.76%
Mortgage Type
Purchase Money Mortgage
Create a Home Valuation Report for This Property
The Home Valuation Report is an in-depth analysis detailing your home's value as well as a comparison with similar homes in the area
Home Values in the Area
Average Home Value in this Area
Purchase History
| Date | Buyer | Sale Price | Title Company |
|---|---|---|---|
| Orteza Danes | $340,000 | Equity Title Company | |
| Sy Richard T | -- | -- | |
| Sy Ricardo T | -- | Chicago Title Co |
Source: Public Records
Mortgage History
| Date | Status | Borrower | Loan Amount |
|---|---|---|---|
| Open | Orteza Danes | $272,000 | |
| Previous Owner | Sy Ricardo T | $123,100 | |
| Closed | Orteza Danes | $33,950 |
Source: Public Records
Tax History Compared to Growth
Tax History
| Year | Tax Paid | Tax Assessment Tax Assessment Total Assessment is a certain percentage of the fair market value that is determined by local assessors to be the total taxable value of land and additions on the property. | Land | Improvement |
|---|---|---|---|---|
| 2025 | $6,830 | $558,150 | $386,718 | $171,432 |
| 2024 | $6,830 | $547,207 | $379,136 | $168,071 |
| 2023 | $6,703 | $536,478 | $371,702 | $164,776 |
| 2022 | $6,399 | $525,960 | $364,414 | $161,546 |
| 2021 | $6,318 | $515,648 | $357,269 | $158,379 |
| 2019 | $6,132 | $500,356 | $346,673 | $153,683 |
| 2018 | $6,040 | $490,546 | $339,876 | $150,670 |
| 2016 | $5,778 | $471,499 | $326,679 | $144,820 |
| 2015 | $5,694 | $464,417 | $321,772 | $142,645 |
| 2014 | $5,720 | $455,320 | $315,469 | $139,851 |
Source: Public Records
Map
Nearby Homes
- 1618 S Burnside Ave
- 1807 Cochran Place
- 1500 Hauser Blvd
- 1614 Hauser Blvd
- 1812 S Dunsmuir Ave
- 1421 S Ridgeley Dr
- 1867 S Cochran Ave
- 5173 Pickford St
- 1851 S Cloverdale Ave
- 1840 S Dunsmuir Ave
- 1432 S Cloverdale Ave
- 1525 Carmona Ave
- 5506 Venice Blvd
- 1861 S Redondo Blvd
- 1359 S Ridgeley Dr
- 1434 S Sierra Bonita Ave
- 1770 Hauser Blvd
- 1728 Carmona Ave
- 1820 Alsace Ave
- 5227 W 20th St
- 1537 S Dunsmuir Ave
- 1545 S Dunsmuir Ave
- 1543 S Dunsmuir Ave
- 1547 S Dunsmuir Ave
- 1533 S Dunsmuir Ave
- 1531 S Dunsmuir Ave
- 1547 -49 S Dunsmuir Ave
- 1553 S Dunsmuir Ave
- 1540 S Burnside Ave
- 1509 S Dunsmuir Ave
- 1544 S Burnside Ave
- 1536 S Burnside Ave
- 1548 S Burnside Ave
- 1532 S Burnside Ave
- 1525 S Dunsmuir Ave
- 1552 S Burnside Ave
- 1540 S Dunsmuir Ave
- 1528 S Burnside Ave
- 1544 S Dunsmuir Ave
- 1536 S Dunsmuir Ave