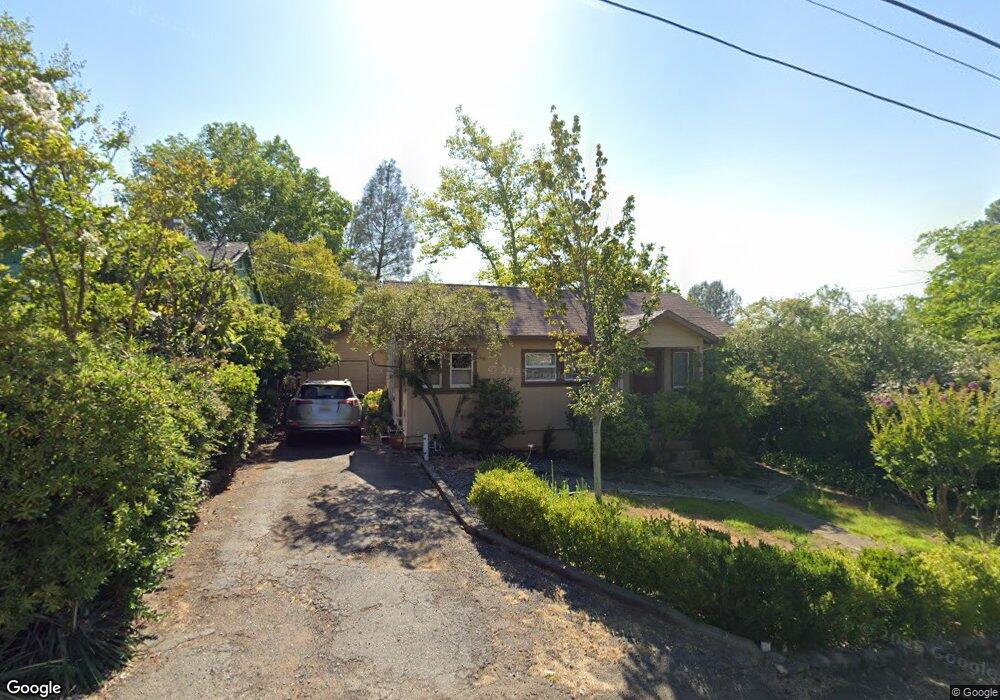
1542 Jay St Redding, CA 96001
Magnolia NeighborhoodEstimated Value: $187,000 - $299,000
1
Bed
1
Bath
856
Sq Ft
$260/Sq Ft
Est. Value
About This Home
This home is located at 1542 Jay St, Redding, CA 96001 and is currently estimated at $222,579, approximately $260 per square foot. 1542 Jay St is a home located in Shasta County with nearby schools including Manzanita Elementary School, Sequoia Middle School, and Shasta High School.
Ownership History
Date
Name
Owned For
Owner Type
Purchase Details
Closed on
Nov 14, 2001
Sold by
Burnett Robert and Burnett Ladora
Bought by
Grigsby Matthew N
Current Estimated Value
Home Financials for this Owner
Home Financials are based on the most recent Mortgage that was taken out on this home.
Original Mortgage
$80,340
Outstanding Balance
$31,169
Interest Rate
6.62%
Estimated Equity
$191,410
Purchase Details
Closed on
Nov 5, 1999
Sold by
Hud
Bought by
Burnett Robert and Burnett Ladora
Home Financials for this Owner
Home Financials are based on the most recent Mortgage that was taken out on this home.
Original Mortgage
$45,600
Interest Rate
7.68%
Purchase Details
Closed on
Aug 18, 1999
Sold by
Norwest Mtg Inc
Bought by
Hud
Purchase Details
Closed on
May 24, 1999
Sold by
Owen Smith T and Isbell Kimberly A
Bought by
Norwest Mtg Inc
Create a Home Valuation Report for This Property
The Home Valuation Report is an in-depth analysis detailing your home's value as well as a comparison with similar homes in the area
Home Values in the Area
Average Home Value in this Area
Purchase History
| Date | Buyer | Sale Price | Title Company |
|---|---|---|---|
| Grigsby Matthew N | $80,500 | Fidelity National Title Co | |
| Burnett Robert | $48,500 | Placer Title Company | |
| Hud | -- | First American Title Ins Co | |
| Norwest Mtg Inc | $79,326 | First American Title Ins Co |
Source: Public Records
Mortgage History
| Date | Status | Borrower | Loan Amount |
|---|---|---|---|
| Open | Grigsby Matthew N | $80,340 | |
| Previous Owner | Burnett Robert | $45,600 |
Source: Public Records
Tax History
| Year | Tax Paid | Tax Assessment Tax Assessment Total Assessment is a certain percentage of the fair market value that is determined by local assessors to be the total taxable value of land and additions on the property. | Land | Improvement |
|---|---|---|---|---|
| 2025 | $1,181 | $118,601 | $29,533 | $89,068 |
| 2024 | $1,161 | $116,276 | $28,954 | $87,322 |
| 2023 | $1,161 | $113,997 | $28,387 | $85,610 |
| 2022 | $1,139 | $111,763 | $27,831 | $83,932 |
| 2021 | $1,132 | $109,573 | $27,286 | $82,287 |
| 2020 | $1,145 | $108,451 | $27,007 | $81,444 |
| 2019 | $1,086 | $106,326 | $26,478 | $79,848 |
| 2018 | $1,094 | $104,242 | $25,959 | $78,283 |
| 2017 | $1,087 | $102,199 | $25,450 | $76,749 |
| 2016 | $1,051 | $100,196 | $24,951 | $75,245 |
| 2015 | $1,036 | $98,692 | $24,577 | $74,115 |
| 2014 | $886 | $84,000 | $30,000 | $54,000 |
Source: Public Records
Map
Nearby Homes
- 1545 Olive Ave
- 2327 Butte St
- 2315 Butte St
- 2565 North St
- 1777 Magnolia Ave
- 1377 Willis St
- 1170 Orange Ave
- 2036 Placer St
- 2351 Eureka Way
- 1129 Magnolia Ave
- 1525 Oak St
- 2077 Skyline Dr
- 3024 West St
- 2381/2401 West St
- 2330 West St
- 1868 Gold St
- 3320 Stratford Ave
- 1355 Bambury Ct
- 1025 Chardonnay Walk
- 3345 Oakwood Place
Your Personal Tour Guide
Ask me questions while you tour the home.