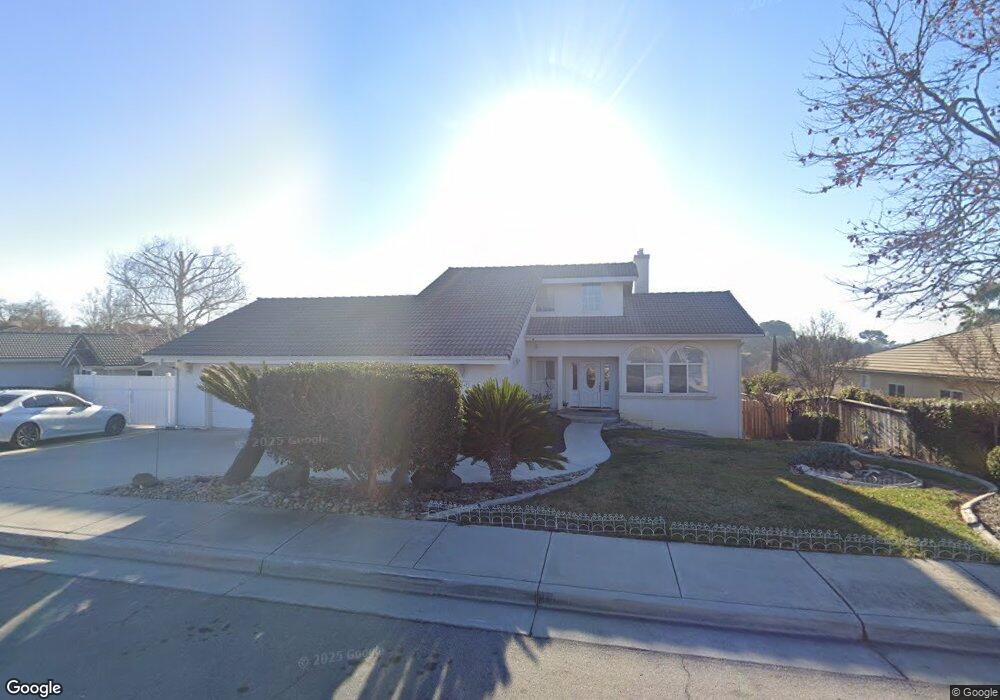
1542 Via Arroyo Paso Robles, CA 93446
Estimated Value: $879,000 - $905,000
3
Beds
3
Baths
2,401
Sq Ft
$372/Sq Ft
Est. Value
About This Home
This home is located at 1542 Via Arroyo, Paso Robles, CA 93446 and is currently estimated at $893,232, approximately $372 per square foot. 1542 Via Arroyo is a home located in San Luis Obispo County with nearby schools including Glen Speck Elementary School, George H. Flamson Middle School, and Paso Robles High School.
Ownership History
Date
Name
Owned For
Owner Type
Purchase Details
Closed on
Oct 3, 2018
Sold by
An Chong Suk and An Sang Chun
Bought by
Record Helen K and An Chong Suk
Current Estimated Value
Purchase Details
Closed on
Aug 2, 2010
Sold by
Record Helen K
Bought by
An Chong Suk and An Sang Chun
Purchase Details
Closed on
May 4, 2010
Sold by
Record Jerry Allen and Record Helen
Bought by
Foran Thomas R and Foran Lorinda A
Purchase Details
Closed on
Feb 7, 2008
Sold by
Record Jerry A
Bought by
Record Helen K
Purchase Details
Closed on
Mar 13, 2000
Sold by
Record Helen and An Chong Suk
Bought by
Record Jerry A and Record Helen K
Home Financials for this Owner
Home Financials are based on the most recent Mortgage that was taken out on this home.
Original Mortgage
$125,000
Interest Rate
8.26%
Create a Home Valuation Report for This Property
The Home Valuation Report is an in-depth analysis detailing your home's value as well as a comparison with similar homes in the area
Home Values in the Area
Average Home Value in this Area
Purchase History
| Date | Buyer | Sale Price | Title Company |
|---|---|---|---|
| Record Helen K | -- | None Available | |
| An Chong Suk | -- | None Available | |
| Foran Thomas R | $251,000 | None Available | |
| Record Helen K | -- | None Available | |
| Record Helen A | -- | None Available | |
| Record Jerry A | -- | Cuesta Title Company |
Source: Public Records
Mortgage History
| Date | Status | Borrower | Loan Amount |
|---|---|---|---|
| Previous Owner | Record Jerry A | $125,000 |
Source: Public Records
Tax History Compared to Growth
Tax History
| Year | Tax Paid | Tax Assessment Tax Assessment Total Assessment is a certain percentage of the fair market value that is determined by local assessors to be the total taxable value of land and additions on the property. | Land | Improvement |
|---|---|---|---|---|
| 2025 | $4,494 | $396,158 | $127,199 | $268,959 |
| 2024 | $4,424 | $388,391 | $124,705 | $263,686 |
| 2023 | $4,424 | $380,776 | $122,260 | $258,516 |
| 2022 | $4,361 | $373,311 | $119,863 | $253,448 |
| 2021 | $4,289 | $365,992 | $117,513 | $248,479 |
| 2020 | $4,233 | $362,241 | $116,309 | $245,932 |
| 2019 | $4,176 | $355,139 | $114,029 | $241,110 |
| 2018 | $4,121 | $348,177 | $111,794 | $236,383 |
| 2017 | $3,886 | $341,351 | $109,602 | $231,749 |
| 2016 | $3,813 | $334,658 | $107,453 | $227,205 |
| 2015 | $3,802 | $329,632 | $105,839 | $223,793 |
| 2014 | $3,676 | $323,176 | $103,766 | $219,410 |
Source: Public Records
Map
Nearby Homes
- 147 Via Camelia
- 1608 Via Flora
- 112 El Dorado Ct
- 1551 Las Brisas Dr
- 420 Creston Rd
- 105 Capitol Hill Dr
- 107 Capitol Hill Dr
- 1751 Skyview Dr
- 1931 Kleck Rd
- 0 Riverside Ave Unit PI25181393
- 726 N Trigo Ln
- 821 Marlbank Place
- 613 Navajo Ave
- 629 Trigo Ln
- 845 Creston Rd
- 1803 Pine St
- 430 Montebello Oaks Dr
- 1810 Park St
- 539 Chumash Ct
- 1446 Park St
- 1544 Via Arroyo
- 1540 Via Arroyo
- 1535 Allegro Ct
- 1534 Allegro Ct
- 1547 Via Arroyo
- 1538 Via Arroyo
- 1533 Allegro Ct
- 1545 Via Arroyo
- 1549 Via Arroyo
- 1532 Allegro Ct
- 1543 Via Arroyo
- 1548 Via Arroyo
- 1551 Via Arroyo
- 1536 Via Arroyo
- 1531 Allegro Ct
- 1600 Via Rosa
- 1530 Allegro Ct
- 1542 Via Rosa
- 1553 Via Arroyo
- 1540 Via Rosa