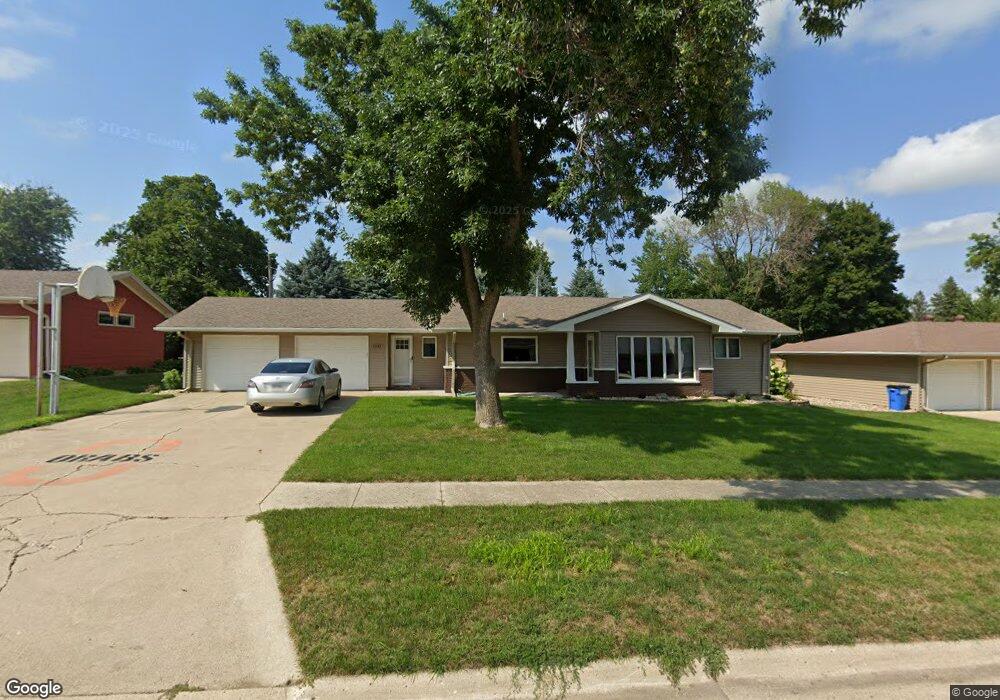
1543 E 3rd St Sheldon, IA 51201
Estimated Value: $239,338 - $278,000
4
Beds
4
Baths
1,488
Sq Ft
$176/Sq Ft
Est. Value
About This Home
This home is located at 1543 E 3rd St, Sheldon, IA 51201 and is currently estimated at $261,585, approximately $175 per square foot. 1543 E 3rd St is a home located in O'Brien County with nearby schools including East Elementary School, Sheldon Middle School, and Sheldon High School.
Ownership History
Date
Name
Owned For
Owner Type
Purchase Details
Closed on
May 31, 2011
Sold by
Grove Phillip R and Grove Pamela J
Bought by
Poppema Gregory A
Current Estimated Value
Home Financials for this Owner
Home Financials are based on the most recent Mortgage that was taken out on this home.
Original Mortgage
$140,000
Outstanding Balance
$54,718
Interest Rate
4.81%
Mortgage Type
Purchase Money Mortgage
Estimated Equity
$206,867
Purchase Details
Closed on
May 12, 2011
Sold by
Gv City Of Sheldon
Bought by
Brink Jessica E and Brink Jari L
Home Financials for this Owner
Home Financials are based on the most recent Mortgage that was taken out on this home.
Original Mortgage
$140,000
Outstanding Balance
$54,718
Interest Rate
4.81%
Mortgage Type
Purchase Money Mortgage
Estimated Equity
$206,867
Create a Home Valuation Report for This Property
The Home Valuation Report is an in-depth analysis detailing your home's value as well as a comparison with similar homes in the area
Home Values in the Area
Average Home Value in this Area
Purchase History
| Date | Buyer | Sale Price | Title Company |
|---|---|---|---|
| Poppema Gregory A | $140,000 | None Available | |
| Brink Jessica E | -- | None Available |
Source: Public Records
Mortgage History
| Date | Status | Borrower | Loan Amount |
|---|---|---|---|
| Open | Poppema Gregory A | $140,000 |
Source: Public Records
Tax History
| Year | Tax Paid | Tax Assessment Tax Assessment Total Assessment is a certain percentage of the fair market value that is determined by local assessors to be the total taxable value of land and additions on the property. | Land | Improvement |
|---|---|---|---|---|
| 2025 | $3,352 | $230,240 | $25,450 | $204,790 |
| 2024 | $3,352 | $213,750 | $22,710 | $191,040 |
| 2023 | $3,280 | $213,750 | $22,710 | $191,040 |
| 2022 | $3,046 | $181,430 | $19,580 | $161,850 |
| 2021 | $3,046 | $181,430 | $19,580 | $161,850 |
| 2020 | $2,704 | $157,430 | $11,750 | $145,680 |
| 2019 | $2,680 | $152,020 | $0 | $0 |
| 2018 | $2,508 | $152,020 | $0 | $0 |
| 2017 | $2,508 | $148,480 | $0 | $0 |
| 2016 | $2,748 | $148,480 | $0 | $0 |
| 2015 | $2,748 | $134,710 | $0 | $0 |
| 2014 | $2,492 | $134,710 | $0 | $0 |
Source: Public Records
Map
Nearby Homes
Your Personal Tour Guide
Ask me questions while you tour the home.