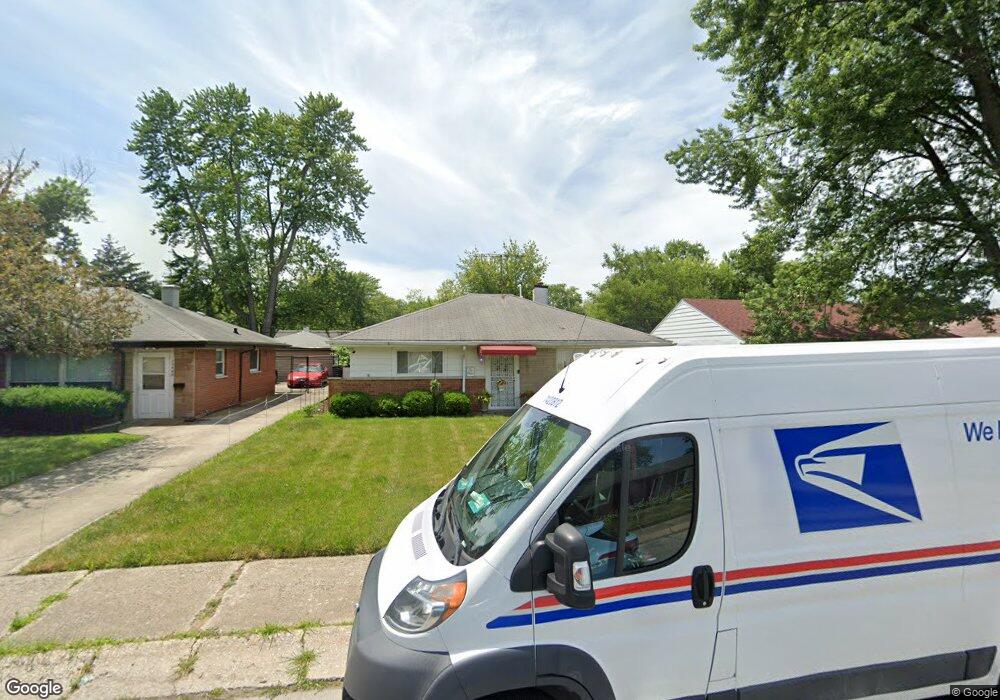
15430 Champlain St South Holland, IL 60473
Estimated Value: $162,627 - $187,000
3
Beds
1
Bath
1,243
Sq Ft
$139/Sq Ft
Est. Value
About This Home
This home is located at 15430 Champlain St, South Holland, IL 60473 and is currently estimated at $172,407, approximately $138 per square foot. 15430 Champlain St is a home located in Cook County with nearby schools including Taft School, Eisenhower School, and Coolidge Middle School.
Ownership History
Date
Name
Owned For
Owner Type
Purchase Details
Closed on
Jan 14, 2025
Sold by
Beck Angelina
Bought by
Beck Angelina and Winston Lorrece
Current Estimated Value
Purchase Details
Closed on
Mar 29, 2018
Sold by
Beck Angelina R and Winston Lorrece
Bought by
Beck Angelina R
Purchase Details
Closed on
Jul 10, 2006
Sold by
Lewis Kelly
Bought by
Beck Angelina R and Winston Lorrence
Home Financials for this Owner
Home Financials are based on the most recent Mortgage that was taken out on this home.
Original Mortgage
$116,910
Interest Rate
6.82%
Mortgage Type
Unknown
Purchase Details
Closed on
Oct 28, 2002
Sold by
Vankley Edith E
Bought by
Lewis Kelly
Home Financials for this Owner
Home Financials are based on the most recent Mortgage that was taken out on this home.
Original Mortgage
$86,275
Interest Rate
6.13%
Mortgage Type
FHA
Create a Home Valuation Report for This Property
The Home Valuation Report is an in-depth analysis detailing your home's value as well as a comparison with similar homes in the area
Home Values in the Area
Average Home Value in this Area
Purchase History
| Date | Buyer | Sale Price | Title Company |
|---|---|---|---|
| Beck Angelina | -- | None Listed On Document | |
| Beck Angelina | -- | None Listed On Document | |
| Beck Angelina R | -- | None Available | |
| Beck Angelina R | $130,000 | First American Title Ins Co | |
| Lewis Kelly | $89,000 | -- |
Source: Public Records
Mortgage History
| Date | Status | Borrower | Loan Amount |
|---|---|---|---|
| Previous Owner | Beck Angelina R | $116,910 | |
| Previous Owner | Lewis Kelly | $86,275 |
Source: Public Records
Tax History Compared to Growth
Tax History
| Year | Tax Paid | Tax Assessment Tax Assessment Total Assessment is a certain percentage of the fair market value that is determined by local assessors to be the total taxable value of land and additions on the property. | Land | Improvement |
|---|---|---|---|---|
| 2024 | $6,535 | $14,000 | $2,656 | $11,344 |
| 2023 | $2,193 | $14,000 | $2,656 | $11,344 |
| 2022 | $2,193 | $9,817 | $2,344 | $7,473 |
| 2021 | $452 | $9,815 | $2,343 | $7,472 |
| 2020 | $396 | $9,815 | $2,343 | $7,472 |
| 2019 | $57 | $6,957 | $2,187 | $4,770 |
| 2018 | $49 | $6,957 | $2,187 | $4,770 |
| 2017 | $114 | $6,957 | $2,187 | $4,770 |
| 2016 | $1,392 | $7,192 | $2,031 | $5,161 |
| 2015 | $1,417 | $7,192 | $2,031 | $5,161 |
| 2014 | $491 | $7,192 | $2,031 | $5,161 |
| 2013 | $1,397 | $7,388 | $2,031 | $5,357 |
Source: Public Records
Map
Nearby Homes
- 717 E 154th St
- 15503 Park Ln
- 749 E 154th St
- 15501 Rose Dr
- 15320 Evers St
- 15439 Elm St
- 15221 Oak St
- 15519 Gouwens Ln
- 15519 Elm St
- 730 E 156th St
- 15612 Langley Ave
- 15304 Grant St
- 15603 Park Ln
- 15501 Maryland Ave
- 15223 Cottage Grove Ave
- 615 E 156th Place
- 619 E 152nd St
- 15542 S Park Ave
- 746 E 157th St
- 428 E 156th Place
- 15420 Champlain St
- 15440 Champlain St
- 15450 Champlain St
- 15410 Champlain St
- 15419 Park Ln
- 15415 Park Ln
- 15425 Park Ln
- 15460 Champlain St
- 15400 Champlain St
- 652 E 154th Place
- 15429 Park Ln
- 15405 Park Ln
- 653 E 154th St
- 15470 Champlain St
- 15433 Park Ln
- 15433 Park Ln
- 658 E 154th Place
- 15463 Champlain St
- 657 E 154th St
- 15480 Champlain St