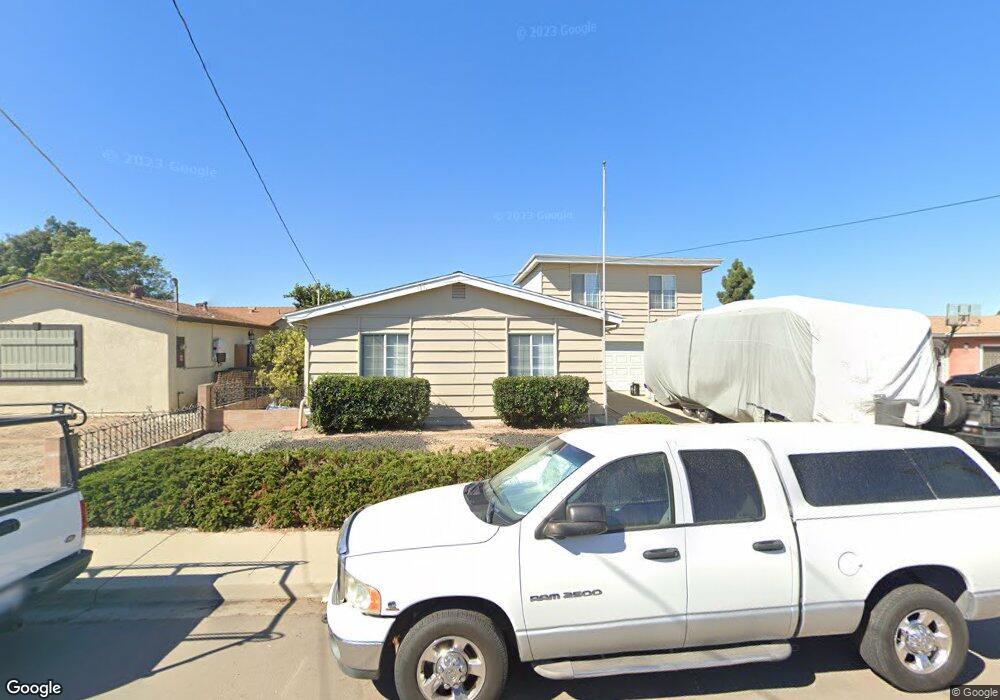
1544 Marble Ct Chula Vista, CA 91911
Castle Park NeighborhoodEstimated Value: $827,122 - $968,000
5
Beds
2
Baths
1,611
Sq Ft
$562/Sq Ft
Est. Value
About This Home
This home is located at 1544 Marble Ct, Chula Vista, CA 91911 and is currently estimated at $905,781, approximately $562 per square foot. 1544 Marble Ct is a home located in San Diego County with nearby schools including Fred H. Rohr Elementary School, Castle Park Middle School, and Castle Park High School.
Ownership History
Date
Name
Owned For
Owner Type
Purchase Details
Closed on
Nov 17, 1994
Sold by
Staiger Thomas P and Staiger Ellen V
Bought by
Hartwick Bryan A
Current Estimated Value
Home Financials for this Owner
Home Financials are based on the most recent Mortgage that was taken out on this home.
Original Mortgage
$100,000
Interest Rate
9.1%
Create a Home Valuation Report for This Property
The Home Valuation Report is an in-depth analysis detailing your home's value as well as a comparison with similar homes in the area
Home Values in the Area
Average Home Value in this Area
Purchase History
| Date | Buyer | Sale Price | Title Company |
|---|---|---|---|
| Hartwick Bryan A | $153,000 | California Coast Title |
Source: Public Records
Mortgage History
| Date | Status | Borrower | Loan Amount |
|---|---|---|---|
| Closed | Hartwick Bryan A | $100,000 |
Source: Public Records
Tax History
| Year | Tax Paid | Tax Assessment Tax Assessment Total Assessment is a certain percentage of the fair market value that is determined by local assessors to be the total taxable value of land and additions on the property. | Land | Improvement |
|---|---|---|---|---|
| 2025 | $2,989 | $256,964 | $109,165 | $147,799 |
| 2024 | $2,989 | $251,926 | $107,025 | $144,901 |
| 2023 | $2,948 | $246,987 | $104,927 | $142,060 |
| 2022 | $2,864 | $242,145 | $102,870 | $139,275 |
| 2021 | $2,798 | $237,398 | $100,853 | $136,545 |
| 2020 | $2,732 | $234,964 | $99,819 | $135,145 |
| 2019 | $2,662 | $230,358 | $97,862 | $132,496 |
| 2018 | $2,621 | $225,843 | $95,944 | $129,899 |
| 2017 | $13 | $221,415 | $94,063 | $127,352 |
| 2016 | $2,507 | $217,074 | $92,219 | $124,855 |
| 2015 | $2,472 | $213,814 | $90,834 | $122,980 |
| 2014 | $2,431 | $209,626 | $89,055 | $120,571 |
Source: Public Records
Map
Nearby Homes
- 1614 Myra Ct
- 1450 Melrose Ave Unit 78
- 1640 Maple Dr
- 1531 Max Ave
- 350 Tourmaline Ct
- 1565 Mendocino Dr Unit 164
- 1691 Melrose Ave
- 1679 Melrose Ave Unit H
- 1677 Melrose Avenue Unit#h
- 1580 Mendocino Dr Unit 90
- 1539 Sonora Dr
- 1512 Concord Way
- 1737 Melrose Ave Unit 63
- 303 Rancho Dr Unit B
- 1408 Oleander Ave
- 265 Rancho Dr Unit C
- 262 Rancho Dr Unit C
- 1324 Park Dr
- 1606 Dana Point Ct
- 1565 San Pedro Point Ct
Your Personal Tour Guide
Ask me questions while you tour the home.