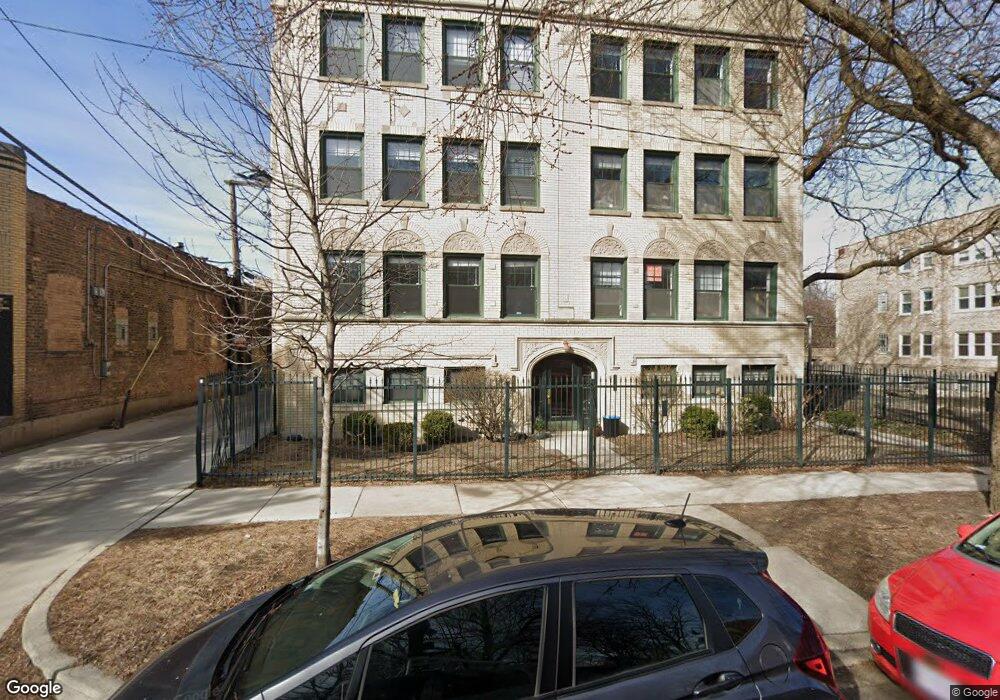
1544 W Thorndale Ave Unit 1544 Chicago, IL 60660
Edgewater NeighborhoodEstimated Value: $291,000 - $425,000
2
Beds
2
Baths
1,500
Sq Ft
$233/Sq Ft
Est. Value
About This Home
This home is located at 1544 W Thorndale Ave Unit 1544, Chicago, IL 60660 and is currently estimated at $350,101, approximately $233 per square foot. 1544 W Thorndale Ave Unit 1544 is a home located in Cook County with nearby schools including Peirce School of International Studies, Senn High School, and Passages Elementary Charter School.
Ownership History
Date
Name
Owned For
Owner Type
Purchase Details
Closed on
Jun 13, 2019
Sold by
Jencius Morgan T and Jencius Michele R
Bought by
H1006 Llc
Current Estimated Value
Home Financials for this Owner
Home Financials are based on the most recent Mortgage that was taken out on this home.
Original Mortgage
$2,036,250
Interest Rate
3.8%
Mortgage Type
Construction
Purchase Details
Closed on
Oct 27, 2009
Sold by
Todd Keith E
Bought by
Jencius Morgan T
Home Financials for this Owner
Home Financials are based on the most recent Mortgage that was taken out on this home.
Original Mortgage
$188,000
Interest Rate
4.96%
Mortgage Type
New Conventional
Purchase Details
Closed on
Nov 15, 2005
Sold by
Mcdonnell John R and Mcdonnell Kelly L
Bought by
Todd Keith E
Home Financials for this Owner
Home Financials are based on the most recent Mortgage that was taken out on this home.
Original Mortgage
$264,000
Interest Rate
6.17%
Mortgage Type
Fannie Mae Freddie Mac
Create a Home Valuation Report for This Property
The Home Valuation Report is an in-depth analysis detailing your home's value as well as a comparison with similar homes in the area
Home Values in the Area
Average Home Value in this Area
Purchase History
| Date | Buyer | Sale Price | Title Company |
|---|---|---|---|
| H1006 Llc | $212,500 | None Available | |
| Jencius Morgan T | $235,000 | Ticor Title | |
| Todd Keith E | $330,000 | Rtc |
Source: Public Records
Mortgage History
| Date | Status | Borrower | Loan Amount |
|---|---|---|---|
| Previous Owner | H1006 Llc | $2,036,250 | |
| Previous Owner | Jencius Morgan T | $188,000 | |
| Previous Owner | Todd Keith E | $264,000 |
Source: Public Records
Tax History Compared to Growth
Tax History
| Year | Tax Paid | Tax Assessment Tax Assessment Total Assessment is a certain percentage of the fair market value that is determined by local assessors to be the total taxable value of land and additions on the property. | Land | Improvement |
|---|---|---|---|---|
| 2024 | $4,216 | $23,028 | $3,509 | $19,519 |
| 2023 | $4,110 | $19,985 | $2,830 | $17,155 |
| 2022 | $4,110 | $19,985 | $2,830 | $17,155 |
| 2021 | $4,018 | $19,983 | $2,829 | $17,154 |
| 2020 | $2,553 | $11,460 | $2,263 | $9,197 |
| 2019 | $4,126 | $23,966 | $2,263 | $21,703 |
| 2018 | $4,056 | $23,966 | $2,263 | $21,703 |
| 2017 | $3,663 | $20,389 | $1,924 | $18,465 |
| 2016 | $3,584 | $20,389 | $1,924 | $18,465 |
| 2015 | $3,256 | $20,389 | $1,924 | $18,465 |
| 2014 | $3,012 | $18,803 | $1,443 | $17,360 |
| 2013 | $2,942 | $18,803 | $1,443 | $17,360 |
Source: Public Records
Map
Nearby Homes
- 5913 N Paulina St Unit 1W
- 1548 W Ardmore Ave Unit 3B
- 1548 W Ardmore Ave Unit 2E
- 1548 W Ardmore Ave Unit 2F
- 1548 W Ardmore Ave Unit 4C
- 1548 W Ardmore Ave Unit 3F
- 6019 N Paulina St
- 5924 N Paulina St Unit 1E
- 6025 N Ridge Ave Unit 1W
- 6060 N Ridge Ave Unit 4D
- 6065 N Hermitage Ave
- 1443 W Victoria St Unit 3E
- 1527 W Edgewater Ave
- 1359 W Elmdale Ave Unit G
- 1425 W Victoria St Unit 3
- 1311 W Thorndale Ave
- 1330 W Early Ave
- 6129 N Ravenswood Ave
- 1254 W Thorndale Ave Unit 1W
- 1331 W Granville Ave
- 1544 W Thorndale Ave Unit 1
- 1542 W Thorndale Ave Unit 1542
- 1542 W Thorndale Ave Unit 1542
- 1542 W Thorndale Ave Unit 1542
- 1544 W Thorndale Ave Unit 1544
- 1544 W Thorndale Ave Unit 1544
- 1542 W Thorndale Ave Unit 1542
- 1542 W Thorndale Ave Unit G
- 1544 W Thorndale Ave Unit 3
- 1542 W Thorndale Ave Unit 2
- 1544 W Thorndale Ave Unit 2
- 1542 W Thorndale Ave Unit 1
- 1542 W Thorndale Ave Unit 3
- 1540 W Thorndale Ave Unit 1540
- 1540 W Thorndale Ave Unit 1540
- 1540 W Thorndale Ave Unit 1540
- 1540 W Thorndale Ave Unit 1
- 1538 W Thorndale Ave Unit 1538
- 1538 W Thorndale Ave Unit 1538
- 1538 W Thorndale Ave Unit 1538