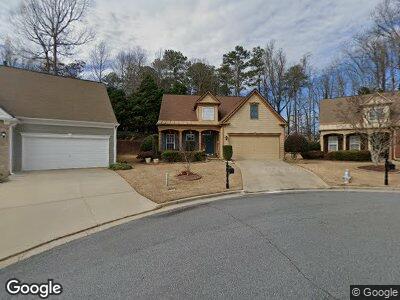
1545 Cloverleaf Place Unit 1B Cumming, GA 30041
Big Creek NeighborhoodEstimated Value: $541,000 - $558,000
3
Beds
3
Baths
2,132
Sq Ft
$257/Sq Ft
Est. Value
About This Home
This home is located at 1545 Cloverleaf Place Unit 1B, Cumming, GA 30041 and is currently estimated at $547,258, approximately $256 per square foot. 1545 Cloverleaf Place Unit 1B is a home located in Forsyth County with nearby schools including Shiloh Point Elementary School, Piney Grove Middle School, and South Forsyth High School.
Ownership History
Date
Name
Owned For
Owner Type
Purchase Details
Closed on
May 1, 2024
Sold by
Szlek Stefan
Bought by
Stefan Szlek Revocable Living Trust and Szlek
Current Estimated Value
Purchase Details
Closed on
Dec 27, 2002
Sold by
Pulte Home Corp
Bought by
Voboril Michael
Home Financials for this Owner
Home Financials are based on the most recent Mortgage that was taken out on this home.
Original Mortgage
$89,879
Interest Rate
6.1%
Mortgage Type
New Conventional
Purchase Details
Closed on
Nov 18, 2002
Sold by
Pulte Home Corp
Bought by
Szlek Stefan and Szlek Halina E
Home Financials for this Owner
Home Financials are based on the most recent Mortgage that was taken out on this home.
Original Mortgage
$89,879
Interest Rate
6.1%
Mortgage Type
New Conventional
Create a Home Valuation Report for This Property
The Home Valuation Report is an in-depth analysis detailing your home's value as well as a comparison with similar homes in the area
Home Values in the Area
Average Home Value in this Area
Purchase History
| Date | Buyer | Sale Price | Title Company |
|---|---|---|---|
| Stefan Szlek Revocable Living Trust | -- | None Listed On Document | |
| Voboril Michael | $180,000 | -- | |
| Szlek Stefan | $198,300 | -- |
Source: Public Records
Mortgage History
| Date | Status | Borrower | Loan Amount |
|---|---|---|---|
| Previous Owner | Szlek Stefan | $175,600 | |
| Previous Owner | Szlek Stefan | $100,000 | |
| Previous Owner | Szlek Stefan | $89,879 |
Source: Public Records
Tax History Compared to Growth
Tax History
| Year | Tax Paid | Tax Assessment Tax Assessment Total Assessment is a certain percentage of the fair market value that is determined by local assessors to be the total taxable value of land and additions on the property. | Land | Improvement |
|---|---|---|---|---|
| 2024 | $676 | $191,736 | $66,000 | $125,736 |
| 2023 | $567 | $168,272 | $62,000 | $106,272 |
| 2022 | $666 | $119,828 | $40,000 | $79,828 |
| 2021 | $647 | $119,828 | $40,000 | $79,828 |
| 2020 | $643 | $115,400 | $40,000 | $75,400 |
| 2019 | $647 | $114,808 | $40,000 | $74,808 |
| 2018 | $638 | $97,816 | $28,000 | $69,816 |
| 2017 | $639 | $91,776 | $28,000 | $63,776 |
| 2016 | $529 | $92,336 | $24,000 | $68,336 |
| 2015 | $528 | $91,140 | $24,000 | $58,616 |
| 2014 | $520 | $74,992 | $24,000 | $50,992 |
Source: Public Records
Map
Nearby Homes
- 1555 Diplomat Dr
- 950 Brook Knoll Ln
- 1254 Peachtree Pkwy
- 1680 Bluestone Dr
- 1620 Diplomat Dr
- 9270 Colham Dr
- 1460 Badingham Dr
- 1400 Squire Ln
- 1410 Bluestone Dr
- 1350 Bluestone Dr
- 1555 Water Vista Ct Unit 4102
- 1435 Harburn Ct Unit III
- 2480 Flint Creek Dr
- 1330 Badingham Dr
- 1815 Montcliff Dr Unit 1
- 1315 Badingham Dr Unit I
- 2510 Bent Creek Way
- 1545 Cloverleaf Place Unit 1B
- 1550 Cloverleaf Place
- 1535 Cloverleaf Place
- 1525 Cloverleaf Place
- 0 Cloverleaf Place Unit 7219273
- 0 Cloverleaf Place Unit 3245806
- 0 Cloverleaf Place Unit 8266974
- 0 Cloverleaf Place Unit 7641319
- 0 Cloverleaf Place Unit 8808318
- 0 Cloverleaf Place Unit 7281660
- 0 Cloverleaf Place Unit 7400329
- 0 Cloverleaf Place Unit 105 7187839
- 0 Cloverleaf Place
- 1125 Peachtree Pkwy
- 1530 Cloverleaf Place Unit 1B
- 1515 Cloverleaf Place Unit 1B
- 1520 Cloverleaf Place Unit 105
- 1520 Cloverleaf Place
- 1515 Seneca Ave
- 1510 Cloverleaf Place