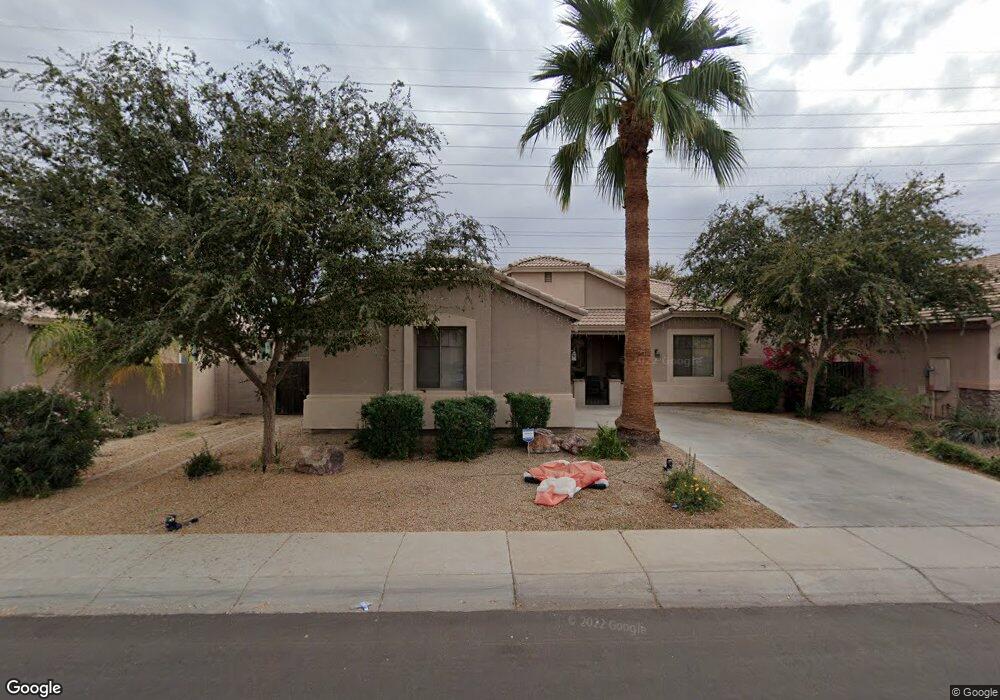
1545 E Aloe Place Chandler, AZ 85286
South Chandler NeighborhoodEstimated Value: $584,000 - $591,642
3
Beds
2
Baths
1,960
Sq Ft
$300/Sq Ft
Est. Value
About This Home
This home is located at 1545 E Aloe Place, Chandler, AZ 85286 and is currently estimated at $588,161, approximately $300 per square foot. 1545 E Aloe Place is a home located in Maricopa County with nearby schools including Basha Elementary School, Santan Junior High School, and Legacy Online Academy.
Ownership History
Date
Name
Owned For
Owner Type
Purchase Details
Closed on
Aug 12, 2015
Sold by
Kilanowski Teryl and Kilanowski Alexander A
Bought by
Kilanowski Alexander A
Current Estimated Value
Home Financials for this Owner
Home Financials are based on the most recent Mortgage that was taken out on this home.
Original Mortgage
$232,000
Outstanding Balance
$182,591
Interest Rate
4.05%
Mortgage Type
New Conventional
Estimated Equity
$405,570
Purchase Details
Closed on
Sep 24, 2002
Sold by
Richmond American Homes Of Arizona Inc
Bought by
Kilanowski Alexander and Kilanowski Teryl
Home Financials for this Owner
Home Financials are based on the most recent Mortgage that was taken out on this home.
Original Mortgage
$164,250
Interest Rate
6.05%
Mortgage Type
New Conventional
Create a Home Valuation Report for This Property
The Home Valuation Report is an in-depth analysis detailing your home's value as well as a comparison with similar homes in the area
Home Values in the Area
Average Home Value in this Area
Purchase History
| Date | Buyer | Sale Price | Title Company |
|---|---|---|---|
| Kilanowski Alexander A | -- | Driggs Title Agency Inc | |
| Kilanowski Alexander | $172,933 | Fidelity National Title |
Source: Public Records
Mortgage History
| Date | Status | Borrower | Loan Amount |
|---|---|---|---|
| Open | Kilanowski Alexander A | $232,000 | |
| Closed | Kilanowski Alexander | $164,250 |
Source: Public Records
Tax History Compared to Growth
Tax History
| Year | Tax Paid | Tax Assessment Tax Assessment Total Assessment is a certain percentage of the fair market value that is determined by local assessors to be the total taxable value of land and additions on the property. | Land | Improvement |
|---|---|---|---|---|
| 2025 | $2,198 | $27,759 | -- | -- |
| 2024 | $2,124 | $26,437 | -- | -- |
| 2023 | $2,124 | $43,760 | $8,750 | $35,010 |
| 2022 | $2,051 | $32,820 | $6,560 | $26,260 |
| 2021 | $2,142 | $30,370 | $6,070 | $24,300 |
| 2020 | $2,132 | $28,580 | $5,710 | $22,870 |
| 2019 | $2,051 | $26,230 | $5,240 | $20,990 |
| 2018 | $1,985 | $24,580 | $4,910 | $19,670 |
| 2017 | $1,851 | $22,000 | $4,400 | $17,600 |
| 2016 | $1,784 | $21,570 | $4,310 | $17,260 |
| 2015 | $1,726 | $20,110 | $4,020 | $16,090 |
Source: Public Records
Map
Nearby Homes
- 3870 S Velero St
- 1544 E Grand Canyon Dr
- 1707 E Carob Dr
- 1945 E Aloe Place
- 1708 E Kaibab Dr
- 1816 E Carob Dr
- 1971 E Yellowstone Place
- 1684 E Coconino Dr
- 3947 S Soho Ln
- 1858 E Coconino Dr
- 4450 S Rio Dr
- Cork Plan at Viviendo
- Oban Plan at Viviendo
- Reine Plan at Viviendo
- Vienne Plan at Viviendo
- 2112 E Yellowstone Place
- 4468 S Leoma Ln
- 1464 E Tonto Dr
- 3855 S Mcqueen Rd Unit 5
- 3855 S Mcqueen Rd Unit 73
- 1525 E Aloe Place
- 1565 E Aloe Place
- 1585 E Aloe Place
- 1515 E Aloe Place
- 1544 E Aloe Place
- 1564 E Aloe Place
- 1524 E Aloe Place
- 1605 E Aloe Place
- 1584 E Aloe Place
- 3960 S Velero St
- 1604 E Aloe Place
- 3940 S Velero St
- 1625 E Aloe Place
- 1543 E Ebony Place
- 1563 E Ebony Place
- 3920 S Velero St
- 1523 E Ebony Place
- 1624 E Aloe Place
- 1530 E Yellowstone Place
- 1583 E Ebony Place