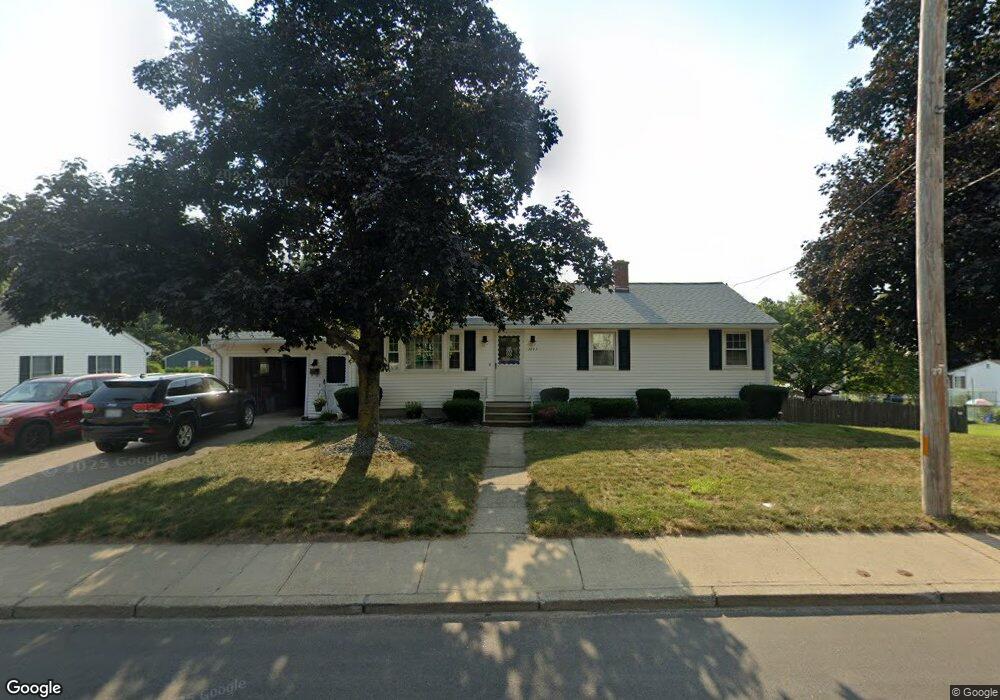
1545 Mendon Rd Woonsocket, RI 02895
East Woonsocket NeighborhoodEstimated Value: $392,000 - $419,199
3
Beds
2
Baths
1,056
Sq Ft
$386/Sq Ft
Est. Value
About This Home
This home is located at 1545 Mendon Rd, Woonsocket, RI 02895 and is currently estimated at $407,300, approximately $385 per square foot. 1545 Mendon Rd is a home located in Providence County with nearby schools including Woonsocket High School and Good Shepherd Catholic School.
Ownership History
Date
Name
Owned For
Owner Type
Purchase Details
Closed on
Jul 13, 2020
Sold by
Murielle M Pinette Lt and Pinette
Bought by
Pinette Brandon M and Gosselin Sara M
Current Estimated Value
Home Financials for this Owner
Home Financials are based on the most recent Mortgage that was taken out on this home.
Original Mortgage
$140,000
Outstanding Balance
$123,825
Interest Rate
3.2%
Mortgage Type
New Conventional
Estimated Equity
$283,475
Purchase Details
Closed on
Jan 9, 2014
Sold by
Pinette Murielle M
Bought by
Pinette Murielle M
Purchase Details
Closed on
Jan 1, 1987
Bought by
Lt Murielle M Pinette
Create a Home Valuation Report for This Property
The Home Valuation Report is an in-depth analysis detailing your home's value as well as a comparison with similar homes in the area
Home Values in the Area
Average Home Value in this Area
Purchase History
| Date | Buyer | Sale Price | Title Company |
|---|---|---|---|
| Pinette Brandon M | $150,000 | None Available | |
| Pinette Brandon M | $150,000 | None Available | |
| Pinette Brandon M | $150,000 | None Available | |
| Pinette Murielle M | -- | -- | |
| Lt Murielle M Pinette | -- | -- | |
| Pinette Murielle M | -- | -- |
Source: Public Records
Mortgage History
| Date | Status | Borrower | Loan Amount |
|---|---|---|---|
| Open | Pinette Brandon M | $140,000 | |
| Closed | Pinette Brandon M | $140,000 |
Source: Public Records
Tax History
| Year | Tax Paid | Tax Assessment Tax Assessment Total Assessment is a certain percentage of the fair market value that is determined by local assessors to be the total taxable value of land and additions on the property. | Land | Improvement |
|---|---|---|---|---|
| 2025 | $4,309 | $383,700 | $111,000 | $272,700 |
| 2024 | $3,948 | $271,500 | $98,500 | $173,000 |
| 2023 | $3,796 | $271,500 | $98,500 | $173,000 |
| 2022 | $3,796 | $271,500 | $98,500 | $173,000 |
| 2021 | $4,505 | $189,700 | $65,400 | $124,300 |
| 2020 | $4,553 | $189,700 | $65,400 | $124,300 |
| 2018 | $4,611 | $191,500 | $65,400 | $126,100 |
| 2017 | $4,319 | $143,500 | $48,400 | $95,100 |
| 2016 | $4,569 | $143,500 | $48,400 | $95,100 |
| 2015 | $5,249 | $143,500 | $48,400 | $95,100 |
| 2014 | $3,583 | $142,400 | $53,200 | $89,200 |
Source: Public Records
Map
Nearby Homes
- 375 Congress St
- 68 Kenwood St
- 42 Armand Ave
- 95 Mitris Blvd
- 727 Mendon Rd
- 23 Rutland St
- 39 Louise St
- 34 Heroux Ave
- 568 Elm St
- 202 Phillips St
- 56 Mailloux St
- 414 Rhode Island Ave
- 311 Elm St
- 410 Carrington Ave
- 271 Elm St
- 263 Elm St
- 216 Bertenshaw Rd
- 346 Carrington Ave
- 345 Carrington Ave
- 110 Saint Leon Ave
Your Personal Tour Guide
Ask me questions while you tour the home.