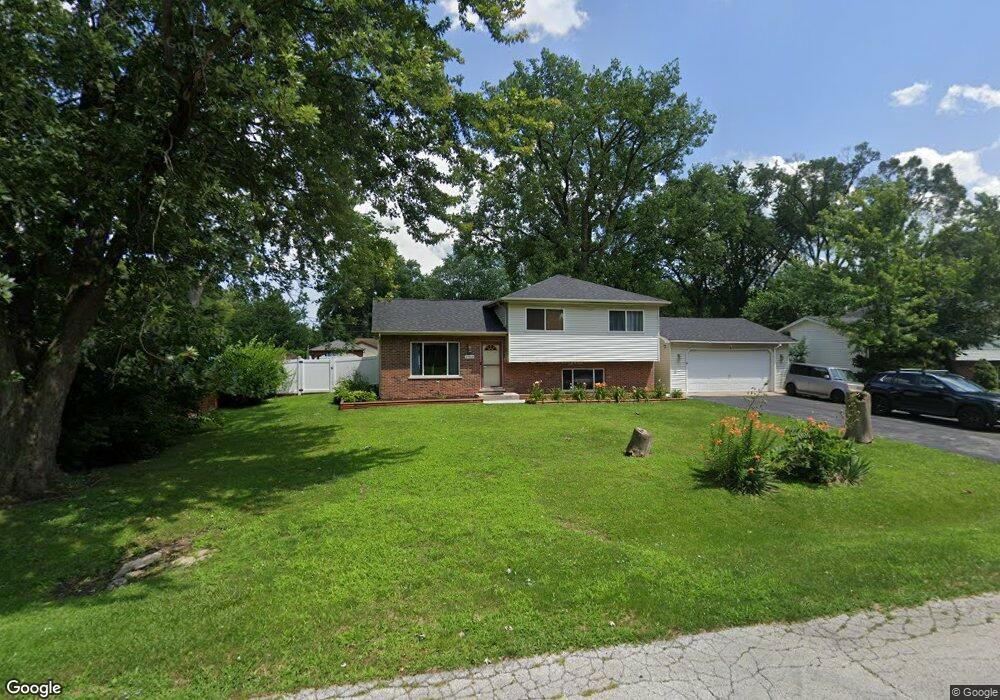
15469 Hamlin Ave Markham, IL 60428
Country Aire NeighborhoodEstimated Value: $190,000 - $223,000
3
Beds
2
Baths
1,029
Sq Ft
$194/Sq Ft
Est. Value
About This Home
This home is located at 15469 Hamlin Ave, Markham, IL 60428 and is currently estimated at $199,378, approximately $193 per square foot. 15469 Hamlin Ave is a home located in Cook County with nearby schools including Fieldcrest Elementary School, Prairie-Hills Junior High School, and Bremen High School.
Ownership History
Date
Name
Owned For
Owner Type
Purchase Details
Closed on
May 31, 2006
Sold by
Amundson Gary
Bought by
Zayas Moises
Current Estimated Value
Home Financials for this Owner
Home Financials are based on the most recent Mortgage that was taken out on this home.
Original Mortgage
$185,000
Interest Rate
6.82%
Mortgage Type
Unknown
Purchase Details
Closed on
Nov 15, 2001
Sold by
Amundson Patricia
Bought by
Amundson Gary
Purchase Details
Closed on
Jul 30, 1997
Sold by
Eck Silliam
Bought by
Amundson Gary B
Home Financials for this Owner
Home Financials are based on the most recent Mortgage that was taken out on this home.
Original Mortgage
$76,000
Interest Rate
7.71%
Purchase Details
Closed on
Sep 23, 1996
Sold by
Pdw Corp
Bought by
Eck Wiliam
Create a Home Valuation Report for This Property
The Home Valuation Report is an in-depth analysis detailing your home's value as well as a comparison with similar homes in the area
Home Values in the Area
Average Home Value in this Area
Purchase History
| Date | Buyer | Sale Price | Title Company |
|---|---|---|---|
| Zayas Moises | $185,000 | Multiple | |
| Amundson Gary | -- | -- | |
| Amundson Gary B | $95,000 | -- | |
| Eck Wiliam | $10,000 | -- |
Source: Public Records
Mortgage History
| Date | Status | Borrower | Loan Amount |
|---|---|---|---|
| Previous Owner | Zayas Moises | $185,000 | |
| Previous Owner | Amundson Gary B | $76,000 |
Source: Public Records
Tax History
| Year | Tax Paid | Tax Assessment Tax Assessment Total Assessment is a certain percentage of the fair market value that is determined by local assessors to be the total taxable value of land and additions on the property. | Land | Improvement |
|---|---|---|---|---|
| 2025 | $6,135 | $10,644 | $898 | $9,746 |
| 2024 | $6,135 | $10,644 | $898 | $9,746 |
| 2023 | $3,820 | $12,941 | $898 | $12,043 |
| 2022 | $3,820 | $7,073 | $798 | $6,275 |
| 2021 | $3,752 | $7,072 | $798 | $6,274 |
| 2020 | $3,789 | $7,072 | $798 | $6,274 |
| 2019 | $4,058 | $7,901 | $698 | $7,203 |
| 2018 | $3,923 | $7,901 | $698 | $7,203 |
| 2017 | $4,998 | $9,760 | $698 | $9,062 |
| 2016 | $3,646 | $7,081 | $598 | $6,483 |
| 2015 | $3,306 | $7,081 | $598 | $6,483 |
| 2014 | $4,163 | $8,391 | $598 | $7,793 |
| 2013 | $3,885 | $8,600 | $598 | $8,002 |
Source: Public Records
Map
Nearby Homes
- 15435 Hamlin Ave
- 15514 Ridgeway Ave
- 3900 W 155th St
- 3851 153rd Place
- 15531 Millard Ave
- 15634 Ridgeway Ave
- 15622 Millard Ave
- 3451 W 155th St
- 15516 Frontage Rd
- 15330 Cherry Ln
- 15333 Cherry Ln
- 15742 Central Park Ave
- 15319 Cherry Ln
- 15826 Central Park Ave
- 3314 Willow Ln
- 15112 Ridgeway Ave
- 15503 Homan Ave
- 15511 Homan Ave
- 15515 Homan Ave
- 15525 Homan Ave
- 15469 Hamlin Ave
- 15465 Hamlin Ave
- 15463 Hamlin Ave
- 15468 Ridgeway Ave
- 15475 Hamlin Ave
- 15457 Hamlin Ave
- 15457 Hamlin Ave
- 15464 Ridgeway Ave
- 15472 Ridgeway Ave
- 15457 Hamlin Ave
- 15457 Hamlin Ave
- 15457 Hamlin Ave
- 15458 Ridgeway Ave
- 15458 Ridgeway Ave
- 15458 Ridgeway Ave
- 15470 Hamlin Ave
- 15476 Ridgeway Ave
- 15462 Hamlin Ave
- 15481 Hamlin Ave
- 15481 Hamlin Ave
Your Personal Tour Guide
Ask me questions while you tour the home.