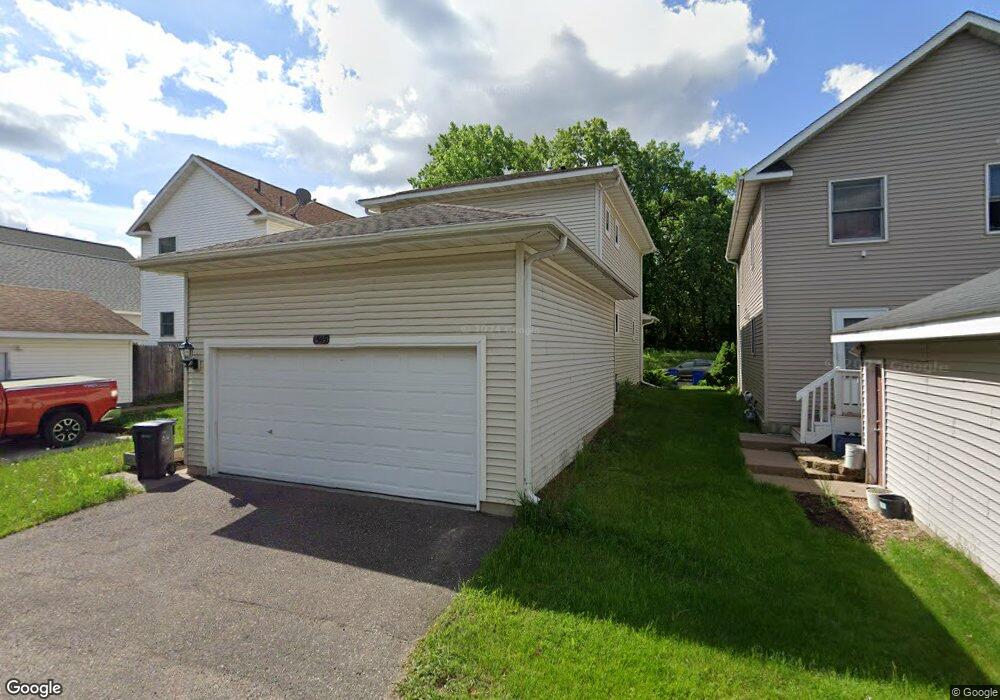
1549 Germain Landing Saint Paul, MN 55106
Roosevelt-Phalen Center NeighborhoodEstimated Value: $247,000 - $285,000
3
Beds
2
Baths
1,496
Sq Ft
$176/Sq Ft
Est. Value
About This Home
This home is located at 1549 Germain Landing, Saint Paul, MN 55106 and is currently estimated at $264,007, approximately $176 per square foot. 1549 Germain Landing is a home located in Ramsey County with nearby schools including Hazel Park Preparatory Academy, Txuj Ci HMong Language and Culture Upper Campus, and Johnson Senior High School.
Ownership History
Date
Name
Owned For
Owner Type
Purchase Details
Closed on
Jun 6, 2022
Sold by
Coleman Michael and Yang Kaying
Bought by
Moo Hser and Kpaw Ta
Current Estimated Value
Home Financials for this Owner
Home Financials are based on the most recent Mortgage that was taken out on this home.
Original Mortgage
$271,600
Outstanding Balance
$258,065
Interest Rate
5.11%
Mortgage Type
New Conventional
Estimated Equity
$5,942
Purchase Details
Closed on
Jan 8, 2020
Sold by
Yang Seethong and Chou Xiong Mai
Bought by
Coleman Michael
Home Financials for this Owner
Home Financials are based on the most recent Mortgage that was taken out on this home.
Original Mortgage
$222,130
Interest Rate
3.6%
Mortgage Type
New Conventional
Purchase Details
Closed on
Nov 29, 2017
Sold by
Yang Seng and Yang Qer
Bought by
Yang Ts Heng and Yang Pay
Home Financials for this Owner
Home Financials are based on the most recent Mortgage that was taken out on this home.
Original Mortgage
$196,377
Interest Rate
3.9%
Mortgage Type
FHA
Create a Home Valuation Report for This Property
The Home Valuation Report is an in-depth analysis detailing your home's value as well as a comparison with similar homes in the area
Home Values in the Area
Average Home Value in this Area
Purchase History
| Date | Buyer | Sale Price | Title Company |
|---|---|---|---|
| Moo Hser | $280,000 | -- | |
| Coleman Michael | $229,000 | Ardent Title Llc | |
| Yang Ts Heng | $200,000 | Trdemark Title Svcs Inc |
Source: Public Records
Mortgage History
| Date | Status | Borrower | Loan Amount |
|---|---|---|---|
| Open | Moo Hser | $271,600 | |
| Previous Owner | Coleman Michael | $222,130 | |
| Previous Owner | Yang Ts Heng | $196,377 |
Source: Public Records
Tax History Compared to Growth
Tax History
| Year | Tax Paid | Tax Assessment Tax Assessment Total Assessment is a certain percentage of the fair market value that is determined by local assessors to be the total taxable value of land and additions on the property. | Land | Improvement |
|---|---|---|---|---|
| 2025 | $3,734 | $230,100 | $50,000 | $180,100 |
| 2023 | $3,734 | $250,100 | $50,000 | $200,100 |
| 2022 | $3,686 | $254,700 | $50,000 | $204,700 |
| 2021 | $3,248 | $238,900 | $50,000 | $188,900 |
| 2020 | $3,298 | $216,100 | $50,000 | $166,100 |
| 2019 | $3,034 | $202,000 | $19,700 | $182,300 |
| 2018 | $2,524 | $184,500 | $19,700 | $164,800 |
| 2017 | $2,170 | $160,400 | $19,700 | $140,700 |
| 2016 | $2,242 | $0 | $0 | $0 |
| 2015 | $2,730 | $152,800 | $19,700 | $133,100 |
| 2014 | $1,914 | $0 | $0 | $0 |
Source: Public Records
Map
Nearby Homes
- 1560 Case Ave
- 935 Kennard St
- 1181 Herbert St
- 1111 Breen St
- 1631 Ross Ave
- 1747 York Ave
- 1675 Maryland Ave E
- 1126 Breen St
- 1769 York Ave
- 1711 Maryland Ave E
- 1732 Maryland Ave E
- 1784 Sims Ave
- 1752 Stillwater Ave
- 1664 Orange Ave E
- 1661 Bush Ave
- 1331 Stillwater Ave
- 1685 Bush Ave
- 1755 Maryland Ave E
- 1368 7th St E
- 1824 Sims Ave
- 1553 Germain Landing
- 1545 Germain Landing
- 1555 Germain Landing
- 1541 Germain Landing
- 1559 Germain Landing
- 1561 Germain Landing
- 1565 Germain Landing
- 1569 Germain Landing
- 1566 Germain Landing
- 1566 1566 Germain-Landing-
- 1025 Hazelwood St
- 1029 Hazelwood St
- 1033 Hazelwood St
- 1037 Hazelwood St
- 1573 1573 Germain-Landing-
- 1573 Germain Landing
- 1041 Hazelwood St
- 1574 Germain Landing
- 1045 Hazelwood St
- 1577 Germain Landing