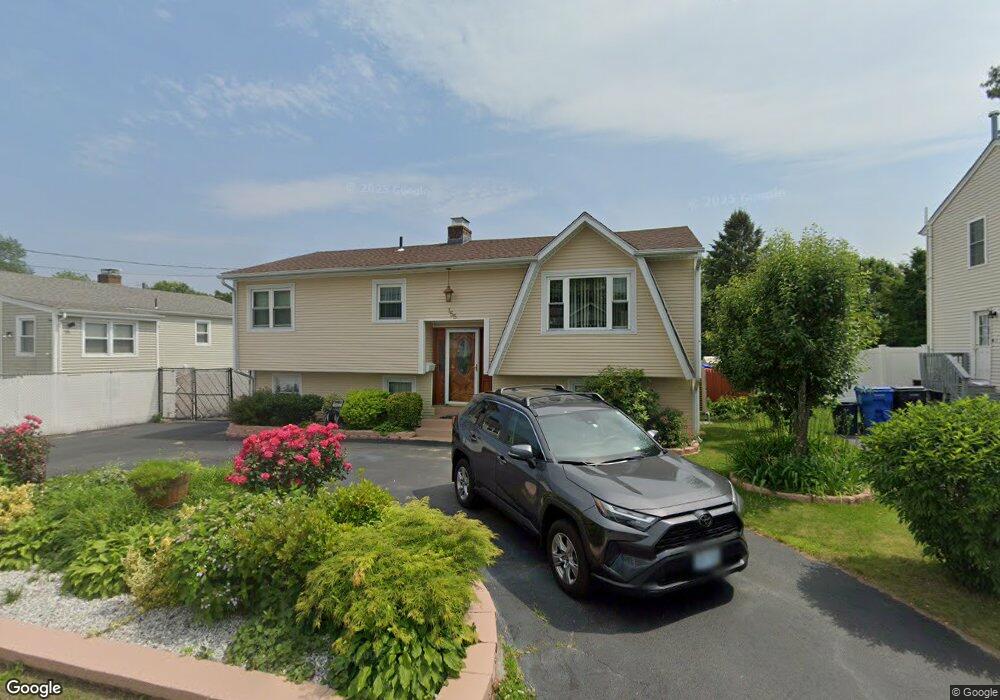
155 Burbank St Cranston, RI 02910
Park View NeighborhoodEstimated Value: $408,000 - $430,911
3
Beds
1
Bath
2,076
Sq Ft
$202/Sq Ft
Est. Value
About This Home
This home is located at 155 Burbank St, Cranston, RI 02910 and is currently estimated at $419,228, approximately $201 per square foot. 155 Burbank St is a home located in Providence County with nearby schools including Edgewood Highland Elementary School, Edward S. Rhodes School, and Park View Middle School.
Ownership History
Date
Name
Owned For
Owner Type
Purchase Details
Closed on
Dec 21, 1998
Sold by
Criscuolo David J and Criscuolo Donna
Bought by
Seng Visith and Phann Veasna
Current Estimated Value
Home Financials for this Owner
Home Financials are based on the most recent Mortgage that was taken out on this home.
Original Mortgage
$74,400
Interest Rate
6.85%
Create a Home Valuation Report for This Property
The Home Valuation Report is an in-depth analysis detailing your home's value as well as a comparison with similar homes in the area
Home Values in the Area
Average Home Value in this Area
Purchase History
| Date | Buyer | Sale Price | Title Company |
|---|---|---|---|
| Seng Visith | $93,000 | -- |
Source: Public Records
Mortgage History
| Date | Status | Borrower | Loan Amount |
|---|---|---|---|
| Open | Seng Visith | $160,000 | |
| Closed | Seng Visith | $74,400 |
Source: Public Records
Tax History Compared to Growth
Tax History
| Year | Tax Paid | Tax Assessment Tax Assessment Total Assessment is a certain percentage of the fair market value that is determined by local assessors to be the total taxable value of land and additions on the property. | Land | Improvement |
|---|---|---|---|---|
| 2025 | $4,847 | $349,200 | $99,000 | $250,200 |
| 2024 | $4,753 | $349,200 | $99,000 | $250,200 |
| 2023 | $4,585 | $242,600 | $68,200 | $174,400 |
| 2022 | $4,491 | $242,600 | $68,200 | $174,400 |
| 2021 | $4,367 | $242,600 | $68,200 | $174,400 |
| 2020 | $4,586 | $220,800 | $64,800 | $156,000 |
| 2019 | $5,779 | $220,800 | $64,800 | $156,000 |
| 2018 | $4,480 | $220,800 | $64,800 | $156,000 |
| 2017 | $4,324 | $188,500 | $47,800 | $140,700 |
| 2016 | $4,232 | $188,500 | $47,800 | $140,700 |
| 2015 | $4,232 | $188,500 | $47,800 | $140,700 |
| 2014 | $3,858 | $168,900 | $47,800 | $121,100 |
Source: Public Records
Map
Nearby Homes
- 1 Evergreen Ct
- 149 Burbank St
- 7 Evergreen Ct
- 150 Burbank St
- 11 Evergreen Ct
- 164 Burbank St
- 148 Burbank St
- 27 Evergreen Ct
- 125 Burbank St
- 2 Evergreen Ct
- 8 Evergreen Ct
- 133 Burbank St
- 12 Evergreen Ct
- 131 Carman St
- 141 Carman St
- 136 Burbank St
- 217 Evergreen St
- 145 Carman St
- 125 Carman St
- 127 Burbank St