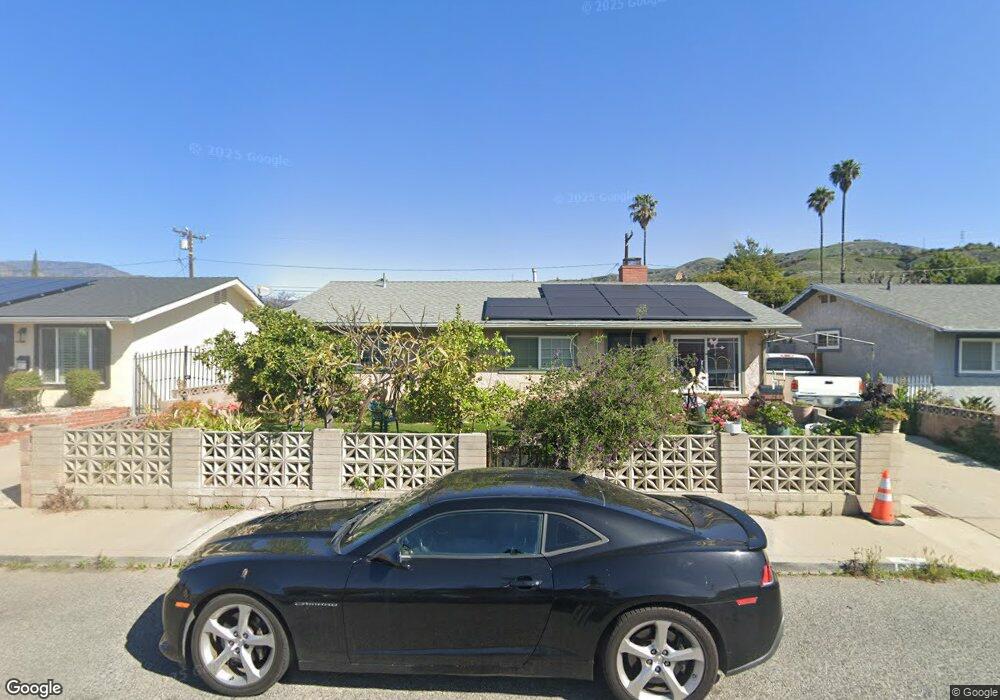
155 Lora Ln Fillmore, CA 93015
Estimated Value: $638,000 - $706,000
4
Beds
2
Baths
1,120
Sq Ft
$600/Sq Ft
Est. Value
About This Home
This home is located at 155 Lora Ln, Fillmore, CA 93015 and is currently estimated at $671,737, approximately $599 per square foot. 155 Lora Ln is a home located in Ventura County with nearby schools including San Cayetano Elementary School and Fillmore Senior High.
Ownership History
Date
Name
Owned For
Owner Type
Purchase Details
Closed on
Jul 13, 2023
Sold by
Duran Guadalupe R and Duran Rita C
Bought by
Duran Family Trust and Duran
Current Estimated Value
Create a Home Valuation Report for This Property
The Home Valuation Report is an in-depth analysis detailing your home's value as well as a comparison with similar homes in the area
Home Values in the Area
Average Home Value in this Area
Purchase History
| Date | Buyer | Sale Price | Title Company |
|---|---|---|---|
| Duran Family Trust | -- | None Listed On Document |
Source: Public Records
Tax History
| Year | Tax Paid | Tax Assessment Tax Assessment Total Assessment is a certain percentage of the fair market value that is determined by local assessors to be the total taxable value of land and additions on the property. | Land | Improvement |
|---|---|---|---|---|
| 2025 | $1,130 | $105,163 | $18,432 | $86,731 |
| 2024 | $1,130 | $103,101 | $18,070 | $85,031 |
| 2023 | $1,114 | $101,080 | $17,716 | $83,364 |
| 2022 | $1,030 | $99,099 | $17,369 | $81,730 |
| 2021 | $1,165 | $97,156 | $17,028 | $80,128 |
| 2020 | $1,081 | $96,161 | $16,854 | $79,307 |
| 2019 | $1,083 | $94,276 | $16,524 | $77,752 |
| 2018 | $1,061 | $92,428 | $16,200 | $76,228 |
| 2017 | $1,065 | $90,617 | $15,883 | $74,734 |
| 2016 | $988 | $88,841 | $15,572 | $73,269 |
| 2015 | $959 | $87,508 | $15,339 | $72,169 |
| 2014 | $957 | $85,796 | $15,040 | $70,756 |
Source: Public Records
Map
Nearby Homes
- 252 Driftwood St
- 199 Rosewood St
- 318 Bard St
- 616 Island View St
- 340 Central Ave
- 404 Central Ave
- 81 Wildwood Ln
- 639 Mountain View St
- 309 Heritage Valley Pkwy
- 250 E Telegraph Rd Unit 200
- 250 E Telegraph Rd Unit 68
- 250 E Telegraph Rd Unit 135
- 250 E Telegraph Rd Unit 213
- 250 E Telegraph Rd Unit 248
- 250 E Telegraph Rd Unit 184
- 250 E Telegraph Rd Unit 221
- 250 E Telegraph Rd Unit 134
- 250 E Telegraph Rd Unit 337
- 250 E Telegraph Rd Unit 197
- 915 E Telegraph Rd
Your Personal Tour Guide
Ask me questions while you tour the home.