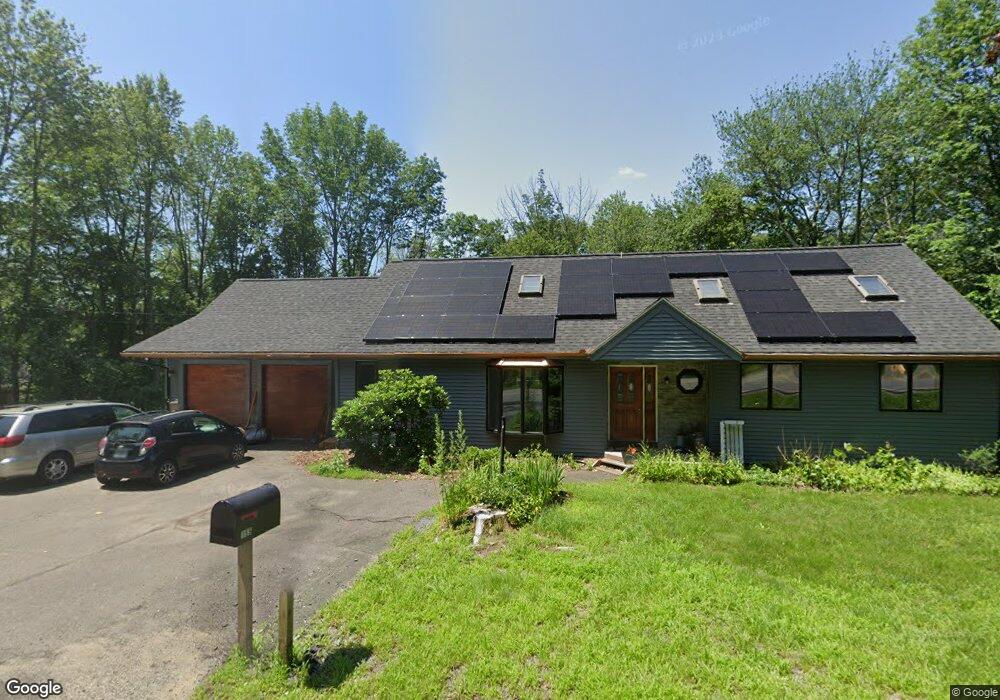
155 Main St Atkinson, NH 03811
Estimated Value: $662,000 - $781,000
2
Beds
3
Baths
3,306
Sq Ft
$221/Sq Ft
Est. Value
About This Home
This home is located at 155 Main St, Atkinson, NH 03811 and is currently estimated at $731,395, approximately $221 per square foot. 155 Main St is a home located in Rockingham County with nearby schools including Atkinson Academy, Timberlane Regional Middle School, and Timberlane Regional High School.
Ownership History
Date
Name
Owned For
Owner Type
Purchase Details
Closed on
Feb 4, 2020
Sold by
Blood Barry M
Bought by
Blood Barry M and Blood Kathleen A
Current Estimated Value
Home Financials for this Owner
Home Financials are based on the most recent Mortgage that was taken out on this home.
Original Mortgage
$252,500
Outstanding Balance
$222,135
Interest Rate
3.6%
Mortgage Type
New Conventional
Estimated Equity
$509,260
Purchase Details
Closed on
Jun 13, 2019
Sold by
Marchand Lois M and Marchand Vincent L
Bought by
Blood Barry M
Create a Home Valuation Report for This Property
The Home Valuation Report is an in-depth analysis detailing your home's value as well as a comparison with similar homes in the area
Home Values in the Area
Average Home Value in this Area
Purchase History
| Date | Buyer | Sale Price | Title Company |
|---|---|---|---|
| Blood Barry M | -- | None Available | |
| Blood Barry M | $100,000 | -- | |
| Blood Barry M | $150,000 | -- | |
| Blood Barry M | $100,000 | -- | |
| Blood Barry M | $150,000 | -- |
Source: Public Records
Mortgage History
| Date | Status | Borrower | Loan Amount |
|---|---|---|---|
| Open | Blood Barry M | $252,500 |
Source: Public Records
Tax History
| Year | Tax Paid | Tax Assessment Tax Assessment Total Assessment is a certain percentage of the fair market value that is determined by local assessors to be the total taxable value of land and additions on the property. | Land | Improvement |
|---|---|---|---|---|
| 2024 | $7,065 | $546,800 | $215,600 | $331,200 |
| 2023 | $7,668 | $528,800 | $215,600 | $313,200 |
| 2022 | $6,488 | $528,800 | $215,600 | $313,200 |
| 2021 | $6,283 | $508,300 | $215,600 | $292,700 |
| 2020 | $8,325 | $331,400 | $144,000 | $187,400 |
| 2019 | $7,258 | $331,400 | $144,000 | $187,400 |
| 2018 | $3,117 | $331,400 | $144,000 | $187,400 |
| 2017 | $5,750 | $331,400 | $144,000 | $187,400 |
| 2016 | $4,390 | $331,400 | $144,000 | $187,400 |
| 2015 | $5,871 | $307,400 | $139,000 | $168,400 |
| 2014 | $5,871 | $307,400 | $139,000 | $168,400 |
| 2013 | $5,841 | $307,400 | $139,000 | $168,400 |
Source: Public Records
Map
Nearby Homes
- 11 Farview Hill Rd
- 169 Main St
- 6 Concord Dr Unit 4
- 29 Lexington Rd
- 17 Winslow Dr
- 3 Pages Ln
- 20 Chandler Dr
- 15 Marilyn Dr
- 92 Main St
- 30 Maple Ave
- 37 Coles Way
- 20 Larson Dr
- 16 Fox Run Ln Unit 10382
- 16 Fox Run Ln
- 7 Wason Ln
- 9 Valcat Ln
- 3 Longview Dr Unit 305
- 1 Longview Dr Unit 110
- 1 Longview Dr Unit 203
- 1 Longview Dr Unit 101
Your Personal Tour Guide
Ask me questions while you tour the home.