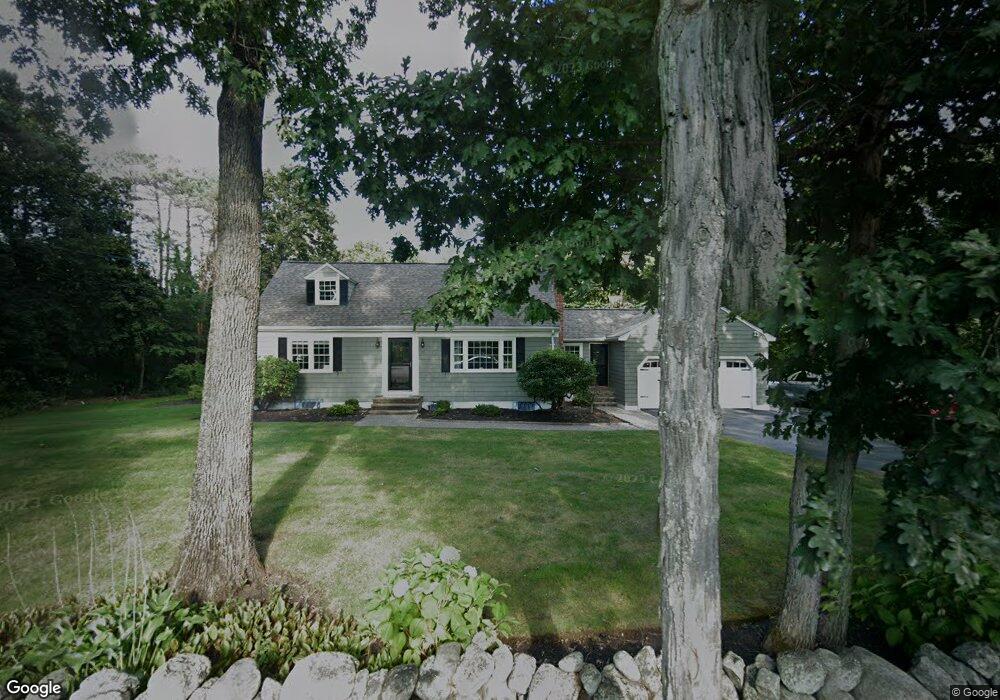
155 Osgood St Unit 1 Andover, MA 01810
Haggetts NeighborhoodEstimated Value: $795,479 - $1,090,000
4
Beds
3
Baths
1,716
Sq Ft
$548/Sq Ft
Est. Value
About This Home
This home is located at 155 Osgood St Unit 1, Andover, MA 01810 and is currently estimated at $940,870, approximately $548 per square foot. 155 Osgood St Unit 1 is a home located in Essex County with nearby schools including Henry C. Sanborn Elementary School, Wood Hill Middle School, and Andover High School.
Ownership History
Date
Name
Owned For
Owner Type
Purchase Details
Closed on
Sep 10, 2021
Sold by
Christensen Dean A and Olingy Jane E
Bought by
Christensen Olingy Ft
Current Estimated Value
Purchase Details
Closed on
Nov 9, 2019
Sold by
Witman Theodore R and Witman Shannon E
Bought by
Christensen Dean A and Olingy Jane E
Home Financials for this Owner
Home Financials are based on the most recent Mortgage that was taken out on this home.
Original Mortgage
$360,000
Interest Rate
3.65%
Mortgage Type
New Conventional
Purchase Details
Closed on
Sep 28, 2007
Sold by
Murray Herbert P and Murray Patti-Lou
Bought by
Witman 2Nd Theodore R and Witman Shannon E
Home Financials for this Owner
Home Financials are based on the most recent Mortgage that was taken out on this home.
Original Mortgage
$336,000
Interest Rate
6.65%
Mortgage Type
Purchase Money Mortgage
Create a Home Valuation Report for This Property
The Home Valuation Report is an in-depth analysis detailing your home's value as well as a comparison with similar homes in the area
Home Values in the Area
Average Home Value in this Area
Purchase History
| Date | Buyer | Sale Price | Title Company |
|---|---|---|---|
| Christensen Olingy Ft | -- | None Available | |
| Christensen Dean A | $650,000 | -- | |
| Witman 2Nd Theodore R | $420,000 | -- |
Source: Public Records
Mortgage History
| Date | Status | Borrower | Loan Amount |
|---|---|---|---|
| Previous Owner | Christensen Dean A | $360,000 | |
| Previous Owner | Witman 2Nd Theodore R | $336,000 |
Source: Public Records
Tax History Compared to Growth
Tax History
| Year | Tax Paid | Tax Assessment Tax Assessment Total Assessment is a certain percentage of the fair market value that is determined by local assessors to be the total taxable value of land and additions on the property. | Land | Improvement |
|---|---|---|---|---|
| 2024 | $10,300 | $799,700 | $515,400 | $284,300 |
| 2023 | $9,850 | $721,100 | $464,900 | $256,200 |
| 2022 | $9,326 | $638,800 | $405,200 | $233,600 |
| 2021 | $8,920 | $583,400 | $369,100 | $214,300 |
| 2020 | $8,556 | $570,000 | $360,400 | $209,600 |
| 2019 | $8,460 | $554,000 | $349,900 | $204,100 |
| 2018 | $8,200 | $524,300 | $336,800 | $187,500 |
| 2017 | $7,836 | $516,200 | $330,300 | $185,900 |
| 2016 | $7,650 | $516,200 | $330,300 | $185,900 |
| 2015 | $7,377 | $492,800 | $317,700 | $175,100 |
Source: Public Records
Map
Nearby Homes
- 1 Stouffer Cir
- 14 Geneva Rd
- 22 Haggetts Pond Rd
- 15 Geneva Rd
- 58 Blanchard St
- 69 Blanchard St
- 14 Regis Rd
- 4 Hazelwood Cir
- 97 Kendall Rd
- 1170 Livingston St
- 399 North St
- 18 Dale St Unit 4G
- 37 Crenshaw Ln Unit 37
- 18 Bryan Ln Unit 18
- 995 North St
- 78 Deering Dr
- 1563 Andover St Unit 18
- 105 Central St
- 25 Clubview Dr Unit 25
- 101 Barry Dr
- 155 Osgood St
- 157 Osgood St
- 151 Osgood St
- 152 Osgood St
- 156 Osgood St
- 148 Osgood St
- 0 Blanchard St Unit 72136390
- 147 Osgood St
- 40 Bellevue Rd
- 160 Osgood St
- 1 Blanchard St
- 36 Bellevue Rd
- 6 Stouffer Cir
- LOT 11 Preston Cir
- 10 Stouffer Cir
- 11 Patricia Cir
- 48 Bellevue Rd
- 9 Patricia Cir
- 8 Stouffer Cir
- 146 Osgood St