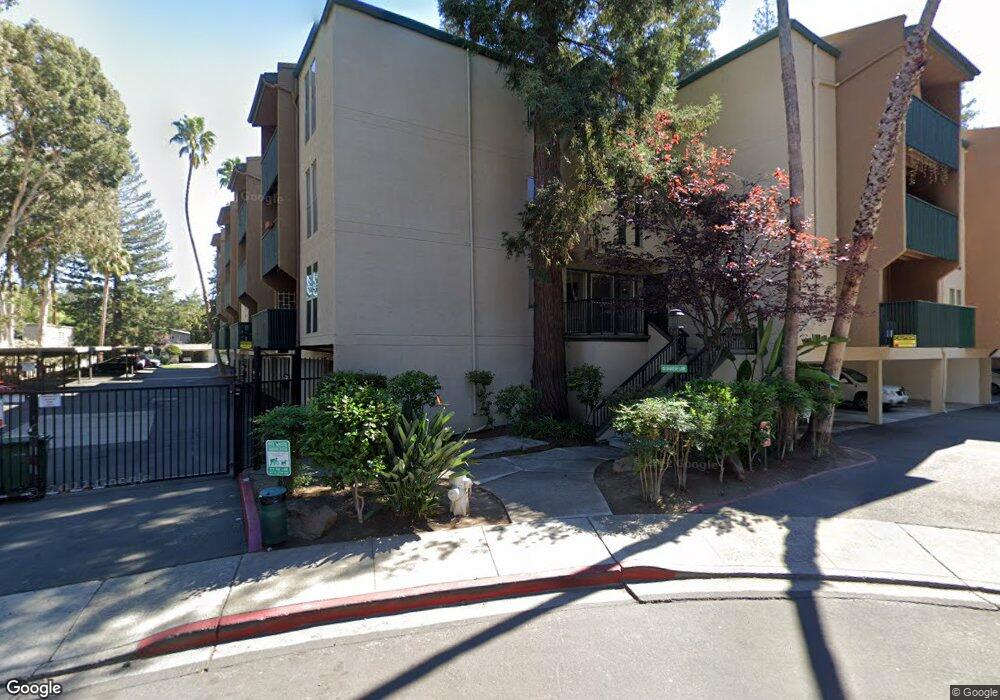
Greenwood Condominiums 155 Sharene Ln Unit 310 Walnut Creek, CA 94596
Howe Homestead NeighborhoodEstimated Value: $299,842 - $409,000
1
Bed
1
Bath
490
Sq Ft
$685/Sq Ft
Est. Value
About This Home
This home is located at 155 Sharene Ln Unit 310, Walnut Creek, CA 94596 and is currently estimated at $335,461, approximately $684 per square foot. 155 Sharene Ln Unit 310 is a home located in Contra Costa County with nearby schools including Indian Valley Elementary School, Walnut Creek Intermediate School, and Las Lomas High School.
Ownership History
Date
Name
Owned For
Owner Type
Purchase Details
Closed on
Dec 14, 2020
Sold by
Mo Jessica and Lee Jessica
Bought by
Mo Jessica
Current Estimated Value
Home Financials for this Owner
Home Financials are based on the most recent Mortgage that was taken out on this home.
Original Mortgage
$80,000
Outstanding Balance
$44,631
Interest Rate
2.65%
Mortgage Type
New Conventional
Estimated Equity
$290,830
Purchase Details
Closed on
Nov 18, 2020
Sold by
Mo Lawrence Sy
Bought by
Mo Jessica
Home Financials for this Owner
Home Financials are based on the most recent Mortgage that was taken out on this home.
Original Mortgage
$80,000
Outstanding Balance
$44,631
Interest Rate
2.65%
Mortgage Type
New Conventional
Estimated Equity
$290,830
Purchase Details
Closed on
Dec 15, 2003
Sold by
Times Investors
Bought by
Lee Jessica
Home Financials for this Owner
Home Financials are based on the most recent Mortgage that was taken out on this home.
Original Mortgage
$154,600
Interest Rate
5.12%
Mortgage Type
Purchase Money Mortgage
Create a Home Valuation Report for This Property
The Home Valuation Report is an in-depth analysis detailing your home's value as well as a comparison with similar homes in the area
Home Values in the Area
Average Home Value in this Area
Purchase History
| Date | Buyer | Sale Price | Title Company |
|---|---|---|---|
| Mo Jessica | -- | American Coast Title | |
| Mo Jessica | -- | American Coast Title | |
| Lee Jessica | $193,500 | North American Title |
Source: Public Records
Mortgage History
| Date | Status | Borrower | Loan Amount |
|---|---|---|---|
| Open | Mo Jessica | $80,000 | |
| Closed | Lee Jessica | $154,600 |
Source: Public Records
Tax History Compared to Growth
Tax History
| Year | Tax Paid | Tax Assessment Tax Assessment Total Assessment is a certain percentage of the fair market value that is determined by local assessors to be the total taxable value of land and additions on the property. | Land | Improvement |
|---|---|---|---|---|
| 2025 | $4,046 | $274,667 | $204,088 | $70,579 |
| 2024 | $3,951 | $269,283 | $200,087 | $69,196 |
| 2023 | $3,951 | $264,004 | $196,164 | $67,840 |
| 2022 | $3,915 | $258,828 | $192,318 | $66,510 |
| 2021 | $3,810 | $253,754 | $188,548 | $65,206 |
| 2019 | $3,705 | $246,229 | $182,956 | $63,273 |
| 2018 | $3,596 | $241,402 | $179,369 | $62,033 |
| 2017 | $3,517 | $236,669 | $175,852 | $60,817 |
| 2016 | $3,437 | $232,029 | $172,404 | $59,625 |
| 2015 | $3,223 | $216,000 | $160,494 | $55,506 |
| 2014 | $3,060 | $201,000 | $149,348 | $51,652 |
Source: Public Records
About Greenwood Condominiums
Map
Nearby Homes
- 155 Sharene Ln Unit 111
- 175 Sierra Dr Unit 309
- 150 Sharene Ln Unit 108
- 185 Sierra Dr Unit 314
- 1680 San Miguel Dr
- 1696 San Miguel Dr Unit F9
- 1640 San Miguel Dr
- 1340 Mount Pisgah Rd
- 61 Alberta Terrace
- 46 Sierra Ln
- 245 Haleena Place
- 1611 Carmel Dr
- 1743 Carmel Dr Unit 9
- 249 Haleena Place
- 251 Haleena Place
- 289 Sierra Dr
- 1201 Alta Vista Dr Unit 209
- 2610 Walnut Blvd
- 135 Cara Ct
- 1282 Carmel Ct
- 155 Sharene Ln
- 155 Sharene Ln
- 155 Sharene Ln Unit 314
- 155 Sharene Ln Unit 312
- 155 Sharene Ln Unit 311
- 155 Sharene Ln Unit 309
- 155 Sharene Ln Unit 308
- 155 Sharene Ln Unit 307
- 155 Sharene Ln Unit 306
- 155 Sharene Ln Unit 305
- 155 Sharene Ln Unit 304
- 155 Sharene Ln Unit 302
- 155 Sharene Ln Unit 301
- 155 Sharene Ln Unit 217
- 155 Sharene Ln Unit 216
- 155 Sharene Ln Unit 116
- 155 Sharene Ln Unit 115
- 155 Sharene Ln Unit 114
- 155 Sharene Ln Unit 113
- 155 Sharene Ln Unit 112