Estimated Value: $357,000 - $466,000
4
Beds
2
Baths
1,019
Sq Ft
$407/Sq Ft
Est. Value
About This Home
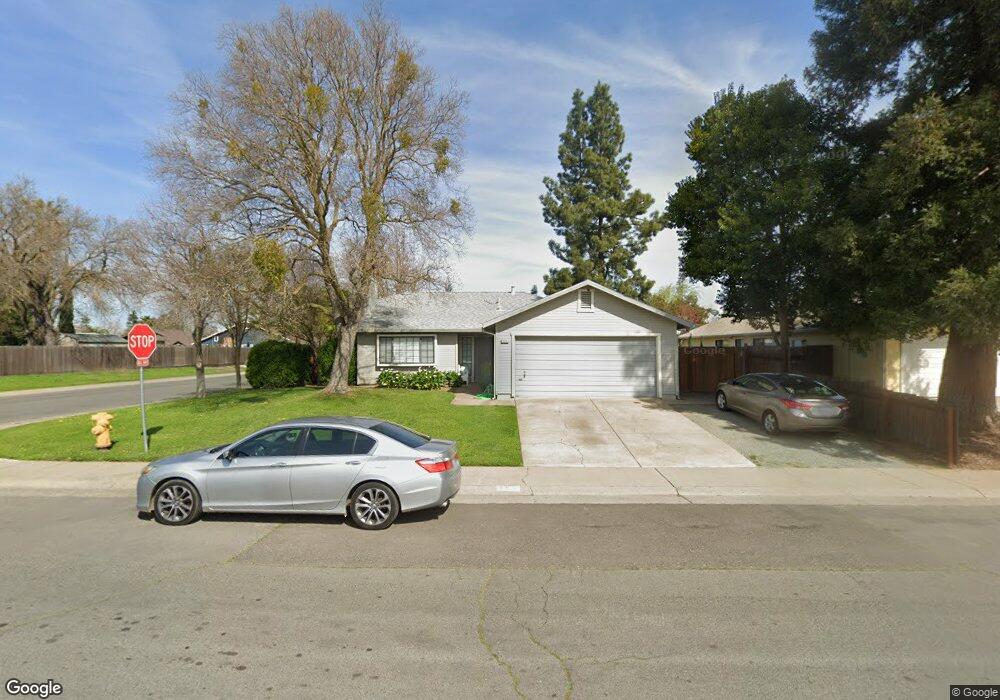
This home is located at 155 W E St, Galt, CA 95632 and is currently estimated at $414,820, approximately $407 per square foot. 155 W E St is a home located in Sacramento County with nearby schools including Valley Oaks Elementary School, Robert L. McCaffrey Middle School, and Galt High School.
Ownership History
Date
Name
Owned For
Owner Type
Purchase Details
Closed on
Jul 10, 2023
Sold by
Gale William R and Gale Michelle
Bought by
William Gale And Michelle Gale 2007 Revocable and Gale
Current Estimated Value
Purchase Details
Closed on
Oct 13, 2011
Sold by
Foster Roy K and Foster Elaine B
Bought by
Gale William R and Gale Michelle
Home Financials for this Owner
Home Financials are based on the most recent Mortgage that was taken out on this home.
Original Mortgage
$84,375
Interest Rate
4.05%
Mortgage Type
New Conventional
Purchase Details
Closed on
Apr 14, 1997
Sold by
Harman Dalinda
Bought by
Foster Roy K and Foster Elaine B
Home Financials for this Owner
Home Financials are based on the most recent Mortgage that was taken out on this home.
Original Mortgage
$119,000
Interest Rate
7.86%
Create a Home Valuation Report for This Property
The Home Valuation Report is an in-depth analysis detailing your home's value as well as a comparison with similar homes in the area
Home Values in the Area
Average Home Value in this Area
Purchase History
| Date | Buyer | Sale Price | Title Company |
|---|---|---|---|
| William Gale And Michelle Gale 2007 Revocable | -- | None Listed On Document | |
| Gale William R | $113,000 | Orange Coast Title Company | |
| Foster Roy K | $119,000 | Sacramento Title Company |
Source: Public Records
Mortgage History
| Date | Status | Borrower | Loan Amount |
|---|---|---|---|
| Previous Owner | Gale William R | $84,375 | |
| Previous Owner | Foster Roy K | $119,000 |
Source: Public Records
Tax History
| Year | Tax Paid | Tax Assessment Tax Assessment Total Assessment is a certain percentage of the fair market value that is determined by local assessors to be the total taxable value of land and additions on the property. | Land | Improvement |
|---|---|---|---|---|
| 2025 | $1,555 | $141,293 | $50,235 | $91,058 |
| 2024 | $1,555 | $138,523 | $49,250 | $89,273 |
| 2023 | $1,529 | $135,808 | $48,285 | $87,523 |
| 2022 | $1,467 | $133,146 | $47,339 | $85,807 |
| 2021 | $1,469 | $130,536 | $46,411 | $84,125 |
| 2020 | $1,457 | $129,199 | $45,936 | $83,263 |
| 2019 | $1,421 | $126,667 | $45,036 | $81,631 |
| 2018 | $1,418 | $124,184 | $44,153 | $80,031 |
| 2017 | $1,363 | $121,750 | $43,288 | $78,462 |
| 2016 | $1,309 | $119,364 | $42,440 | $76,924 |
| 2015 | $1,264 | $117,572 | $41,803 | $75,769 |
| 2014 | $1,261 | $115,270 | $40,985 | $74,285 |
Source: Public Records
Map
Nearby Homes
Your Personal Tour Guide
Ask me questions while you tour the home.