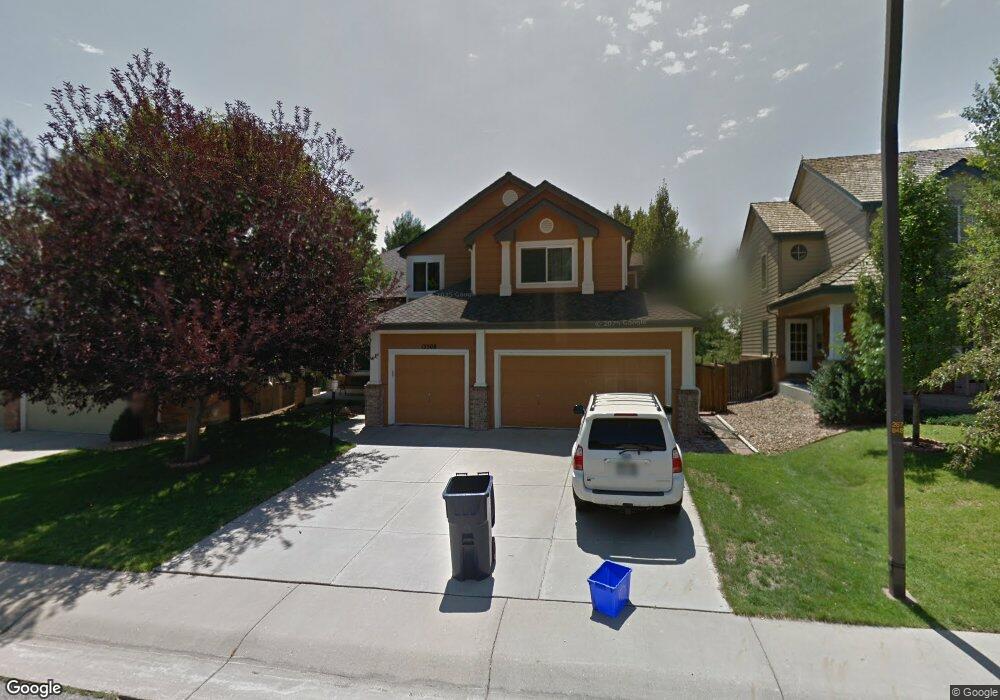
15508 Flowergate Way Parker, CO 80134
Stonegate NeighborhoodEstimated Value: $705,000 - $732,027
4
Beds
4
Baths
2,595
Sq Ft
$277/Sq Ft
Est. Value
About This Home
This home is located at 15508 Flowergate Way, Parker, CO 80134 and is currently estimated at $719,507, approximately $277 per square foot. 15508 Flowergate Way is a home located in Douglas County with nearby schools including Pine Grove Elementary School, Sierra Middle School, and Chaparral High School.
Ownership History
Date
Name
Owned For
Owner Type
Purchase Details
Closed on
Mar 14, 2007
Sold by
Oconnor Christy T
Bought by
Mischler Marcus P
Current Estimated Value
Home Financials for this Owner
Home Financials are based on the most recent Mortgage that was taken out on this home.
Original Mortgage
$284,800
Outstanding Balance
$172,951
Interest Rate
6.32%
Mortgage Type
Unknown
Estimated Equity
$546,556
Purchase Details
Closed on
Apr 4, 2002
Sold by
Schimmoller Darrell J and Schimmoller Carol
Bought by
Oconnor Christy T
Home Financials for this Owner
Home Financials are based on the most recent Mortgage that was taken out on this home.
Original Mortgage
$182,500
Interest Rate
6.78%
Mortgage Type
Balloon
Purchase Details
Closed on
Oct 29, 1992
Sold by
Falcon Partnership Ltd
Bought by
Schimmoller Darrell J and Schimmoller Carol
Purchase Details
Closed on
Feb 21, 1992
Sold by
Stonegate Dev Inc
Bought by
Falcon Homes Ltd
Create a Home Valuation Report for This Property
The Home Valuation Report is an in-depth analysis detailing your home's value as well as a comparison with similar homes in the area
Home Values in the Area
Average Home Value in this Area
Purchase History
| Date | Buyer | Sale Price | Title Company |
|---|---|---|---|
| Mischler Marcus P | $356,000 | Chicago Title Co | |
| Oconnor Christy T | $312,500 | -- | |
| Schimmoller Darrell J | $175,200 | -- | |
| Falcon Homes Ltd | $210,200 | -- |
Source: Public Records
Mortgage History
| Date | Status | Borrower | Loan Amount |
|---|---|---|---|
| Open | Mischler Marcus P | $284,800 | |
| Previous Owner | Oconnor Christy T | $182,500 |
Source: Public Records
Tax History Compared to Growth
Tax History
| Year | Tax Paid | Tax Assessment Tax Assessment Total Assessment is a certain percentage of the fair market value that is determined by local assessors to be the total taxable value of land and additions on the property. | Land | Improvement |
|---|---|---|---|---|
| 2024 | $5,236 | $52,580 | $9,640 | $42,940 |
| 2023 | $5,282 | $52,580 | $9,640 | $42,940 |
| 2022 | $4,055 | $36,730 | $6,540 | $30,190 |
| 2021 | $4,169 | $36,730 | $6,540 | $30,190 |
| 2020 | $3,987 | $36,010 | $7,860 | $28,150 |
| 2019 | $3,890 | $36,010 | $7,860 | $28,150 |
| 2018 | $3,408 | $31,120 | $7,090 | $24,030 |
| 2017 | $3,214 | $31,120 | $7,090 | $24,030 |
| 2016 | $3,152 | $30,040 | $6,410 | $23,630 |
| 2015 | $3,213 | $30,040 | $6,410 | $23,630 |
| 2014 | $3,099 | $26,120 | $6,220 | $19,900 |
Source: Public Records
Map
Nearby Homes
- 15565 Flowerhill Cir
- 10312 Stoneflower Dr
- 10553 Stonemeadow Dr
- 10530 Winterflower Way
- 10519 Winterflower Way
- 10676 Cottoneaster Way
- 10311 Mica Way
- 10539 Casper Point
- 10397 Helsinki St
- 10158 Stoneridge Terrace
- 10849 Tundra Top Dr
- 10832 Tundra Top Dr
- 14938 Vienna Cir
- 10828 Snowdon St
- 10873 Tundra Top Dr
- 15033 Delhi Ave
- 10834 Snowdon St
- 14969 Elsinore Ave
- 16056 Quarry Hill Dr
- 14799 Munich Ave
- 15518 Flowergate Way
- 15498 Flowergate Way
- 15528 Flowergate Way
- 15488 Flowergate Way
- 15507 Flowergate Way
- 15517 Flowergate Way
- 15497 Flowergate Way
- 15527 Flowergate Way
- 15538 Flowergate Way
- 15478 Flowergate Way
- 15590 Flowerhill Cir
- 10545 Cottoneaster Way
- 10468 Flowerhill Ct
- 15510 Flowerhill Cir
- 15468 Flowergate Way
- 15518 Flowerhill Cir
- 10555 Cottoneaster Way
- 10525 Cottoneaster Way
- 10460 Flowerhill Ct
- 15582 Flowerhill Cir