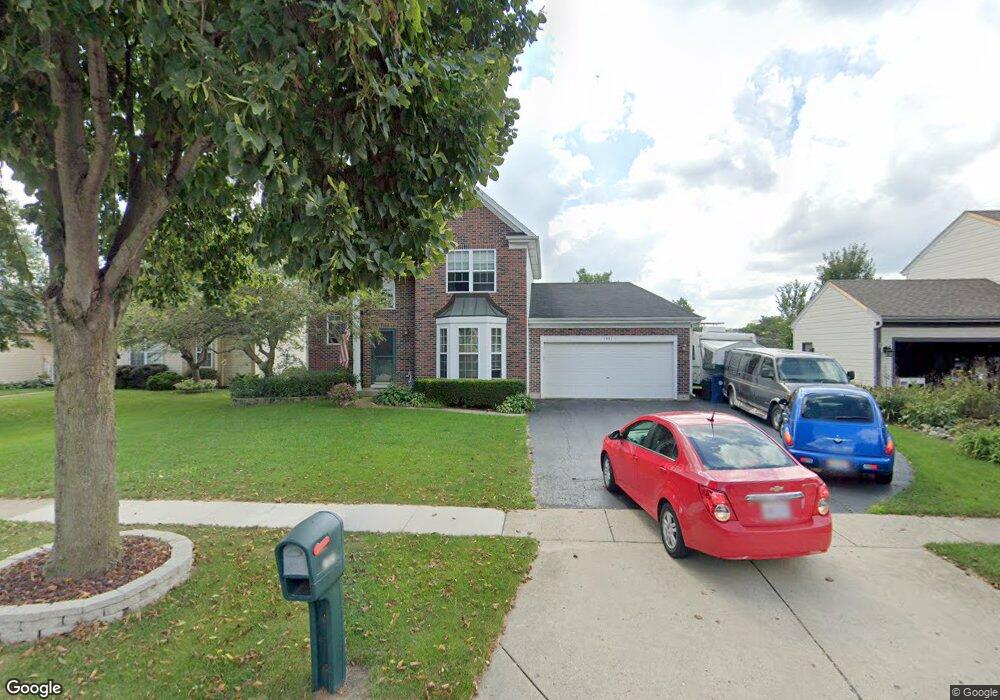
1551 Cumberland Pkwy Algonquin, IL 60102
Estimated Value: $397,689 - $420,000
--
Bed
1
Bath
1,595
Sq Ft
$257/Sq Ft
Est. Value
About This Home
This home is located at 1551 Cumberland Pkwy, Algonquin, IL 60102 and is currently estimated at $410,172, approximately $257 per square foot. 1551 Cumberland Pkwy is a home located in McHenry County with nearby schools including Algonquin Lakes Elementary School, Algonquin Middle School, and Dundee-Crown High School.
Ownership History
Date
Name
Owned For
Owner Type
Purchase Details
Closed on
Nov 7, 2018
Sold by
Williams Jeffrey and Williams Constance Anne
Bought by
Williams Todd Jeffrey and Williams Constance Anne
Current Estimated Value
Purchase Details
Closed on
Aug 25, 2000
Sold by
Jackson James and Jackson Lisa
Bought by
Williams Todd J and Williams Constance A
Home Financials for this Owner
Home Financials are based on the most recent Mortgage that was taken out on this home.
Original Mortgage
$120,000
Outstanding Balance
$44,231
Interest Rate
8.26%
Estimated Equity
$365,941
Purchase Details
Closed on
Aug 15, 1996
Sold by
Algonquin State Bank
Bought by
Jackson James G and Jackson Lisa A
Home Financials for this Owner
Home Financials are based on the most recent Mortgage that was taken out on this home.
Original Mortgage
$115,000
Interest Rate
7.87%
Create a Home Valuation Report for This Property
The Home Valuation Report is an in-depth analysis detailing your home's value as well as a comparison with similar homes in the area
Home Values in the Area
Average Home Value in this Area
Purchase History
| Date | Buyer | Sale Price | Title Company |
|---|---|---|---|
| Williams Todd Jeffrey | -- | First American Title | |
| Williams Todd J | $179,000 | -- | |
| Jackson James G | $158,000 | Northern Land Title Corp |
Source: Public Records
Mortgage History
| Date | Status | Borrower | Loan Amount |
|---|---|---|---|
| Open | Williams Todd J | $120,000 | |
| Previous Owner | Jackson James G | $115,000 |
Source: Public Records
Tax History Compared to Growth
Tax History
| Year | Tax Paid | Tax Assessment Tax Assessment Total Assessment is a certain percentage of the fair market value that is determined by local assessors to be the total taxable value of land and additions on the property. | Land | Improvement |
|---|---|---|---|---|
| 2024 | $9,746 | $132,582 | $22,714 | $109,868 |
| 2023 | $9,257 | $118,578 | $20,315 | $98,263 |
| 2022 | $7,224 | $90,236 | $20,766 | $69,470 |
| 2021 | $6,927 | $84,066 | $19,346 | $64,720 |
| 2020 | $6,743 | $81,090 | $18,661 | $62,429 |
| 2019 | $6,576 | $77,613 | $17,861 | $59,752 |
| 2018 | $6,732 | $76,632 | $21,072 | $55,560 |
| 2017 | $6,591 | $72,192 | $19,851 | $52,341 |
| 2016 | $6,489 | $67,709 | $18,618 | $49,091 |
| 2013 | -- | $59,624 | $17,368 | $42,256 |
Source: Public Records
Map
Nearby Homes
- 1561 Cumberland Pkwy
- 1659 E Algonquin Rd
- 1770 E Algonquin Rd
- Lot 4 b Ryan Pkwy
- 920 Plymouth Ct
- 911 Old Oak Cir Unit 1
- 903 Old Oak Cir
- 605 Claymont Ct
- 1782 Cumberland Pkwy
- 2 Cumberland Pkwy
- 1188 E Algonquin Rd
- 14 Oxford Ct
- 620 Old Oak Cir
- 2 Sunset Ln
- 1943 Ozark Pkwy
- 2008 Clematis Dr
- 69 Alice St
- 600 E Algonquin Rd
- 9999 Sandbloom Rd
- 925 N River Rd
- 1541 Cumberland Pkwy
- 1571 Cumberland Pkwy
- 1531 Cumberland Pkwy
- 1581 Cumberland Pkwy
- 1521 Cumberland Pkwy
- 1530 Cumberland Pkwy
- 1520 Cumberland Pkwy
- 1540 Cumberland Pkwy
- 1510 Cumberland Pkwy
- 1550 Cumberland Pkwy
- 1511 Cumberland Pkwy
- 1500 Cumberland Pkwy
- 1591 Cumberland Pkwy
- 1414 E Algonquin Rd
- 1560 Cumberland Pkwy
- 1406 E Algonquin Rd Unit CARY
- 1605 Thorneapple Ln
- 1490 Cumberland Pkwy
- 1501 Cumberland Pkwy Unit 4
- 1601 Cumberland Pkwy