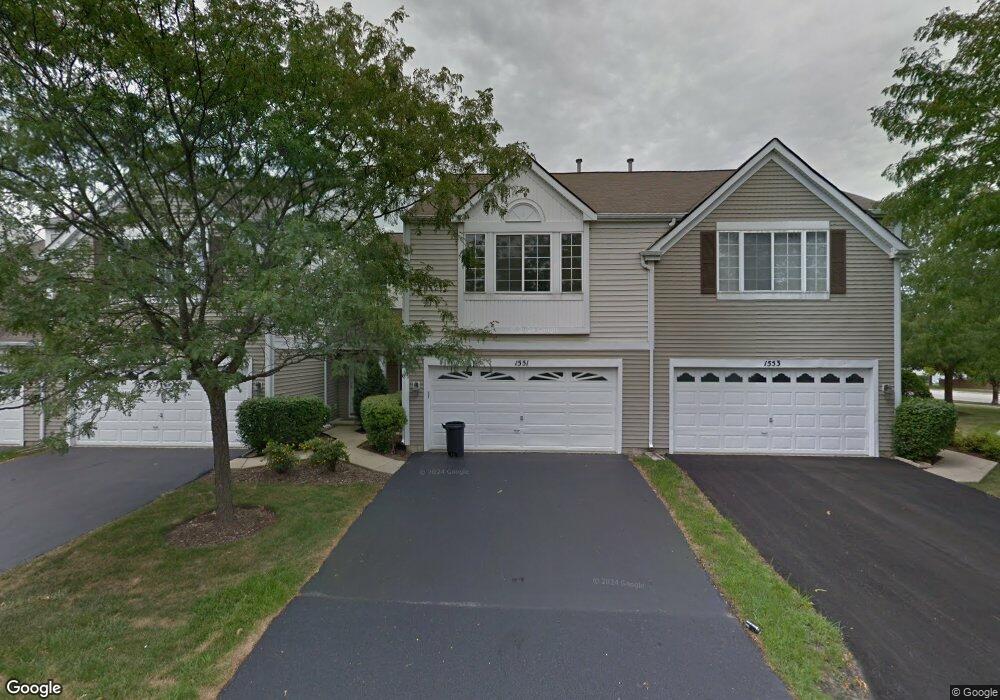
1551 Spaulding Rd Unit 475 Bartlett, IL 60103
Estimated Value: $310,000 - $325,000
3
Beds
3
Baths
1,300
Sq Ft
$246/Sq Ft
Est. Value
About This Home
This home is located at 1551 Spaulding Rd Unit 475, Bartlett, IL 60103 and is currently estimated at $319,931, approximately $246 per square foot. 1551 Spaulding Rd Unit 475 is a home located in Cook County with nearby schools including Liberty Elementary School, Kenyon Woods Middle School, and South Elgin High School.
Ownership History
Date
Name
Owned For
Owner Type
Purchase Details
Closed on
Jun 29, 2001
Sold by
Arshad Javed
Bought by
Iqbal Asif
Current Estimated Value
Home Financials for this Owner
Home Financials are based on the most recent Mortgage that was taken out on this home.
Original Mortgage
$157,035
Outstanding Balance
$57,865
Interest Rate
7.18%
Mortgage Type
FHA
Estimated Equity
$262,066
Purchase Details
Closed on
Dec 30, 1999
Sold by
Siedlecki Jeffrey A and Siedlecki Kira M
Bought by
Arshad Javed
Home Financials for this Owner
Home Financials are based on the most recent Mortgage that was taken out on this home.
Original Mortgage
$135,800
Interest Rate
8.26%
Mortgage Type
FHA
Purchase Details
Closed on
Sep 29, 1995
Sold by
Pulte Home Corp
Bought by
Siedlecki Jeffrey and Siedlecki Kira M
Home Financials for this Owner
Home Financials are based on the most recent Mortgage that was taken out on this home.
Original Mortgage
$117,450
Interest Rate
7.68%
Mortgage Type
FHA
Create a Home Valuation Report for This Property
The Home Valuation Report is an in-depth analysis detailing your home's value as well as a comparison with similar homes in the area
Home Values in the Area
Average Home Value in this Area
Purchase History
| Date | Buyer | Sale Price | Title Company |
|---|---|---|---|
| Iqbal Asif | $159,500 | Djh Title & Abstract | |
| Arshad Javed | $143,000 | -- | |
| Siedlecki Jeffrey | $124,000 | Intercounty Title |
Source: Public Records
Mortgage History
| Date | Status | Borrower | Loan Amount |
|---|---|---|---|
| Open | Iqbal Asif | $157,035 | |
| Previous Owner | Arshad Javed | $135,800 | |
| Previous Owner | Siedlecki Jeffrey | $117,450 |
Source: Public Records
Tax History
| Year | Tax Paid | Tax Assessment Tax Assessment Total Assessment is a certain percentage of the fair market value that is determined by local assessors to be the total taxable value of land and additions on the property. | Land | Improvement |
|---|---|---|---|---|
| 2025 | $7,039 | $31,577 | $11,256 | $20,321 |
| 2024 | $7,039 | $22,240 | $9,568 | $12,672 |
| 2023 | $6,802 | $22,240 | $9,568 | $12,672 |
| 2022 | $6,802 | $22,240 | $9,568 | $12,672 |
| 2021 | $6,060 | $16,308 | $8,442 | $7,866 |
| 2020 | $5,979 | $16,308 | $8,442 | $7,866 |
| 2019 | $5,957 | $18,166 | $8,442 | $9,724 |
| 2018 | $6,200 | $17,343 | $7,316 | $10,027 |
| 2017 | $6,095 | $17,343 | $7,316 | $10,027 |
| 2016 | $5,691 | $17,343 | $7,316 | $10,027 |
| 2015 | $5,291 | $14,917 | $6,472 | $8,445 |
| 2014 | $5,224 | $14,917 | $6,472 | $8,445 |
| 2013 | $5,023 | $14,917 | $6,472 | $8,445 |
Source: Public Records
Map
Nearby Homes
- 1627 Spaulding Rd Unit 524
- 529 Rose Ln
- 1316 Foxglove Dr
- 1314 Foxglove Dr
- 610 Golfers Ln
- 1810 Golf View Dr
- 1261 Foxglove Dr
- 1328 Foxglove Dr
- 1326 Foxglove Dr
- 1324 Foxglove Dr
- 106 8th Ave
- 1285 Foxglove Dr
- 1283 Foxglove Dr
- 1376 Foxglove Dr
- 1374 Foxglove Dr
- 1372 Foxglove Dr
- 1330 Foxglove Dr
- 1368 Foxglove Dr
- 1332 Foxglove Dr
- 1334 Foxglove Dr
- 1553 Spaulding Rd Unit 476
- 1549 Spaulding Rd Unit 474
- 1547 Spaulding Rd Unit 473
- 1545 Spaulding Rd Unit B
- 1545 Spaulding Rd Unit 472
- 1545 Spaulding Rd Unit 1545
- 1563 Spaulding Rd Unit 482
- 1543 Spaulding Rd Unit 471
- 1543 Spaulding Rd Unit 1543
- 1543 Spaulding Rd
- 1561 Spaulding Rd Unit 481
- 1565 Spaulding Rd Unit 483
- 1567 Spaulding Rd Unit 484
- 1567 Spaulding Rd Unit 1567
- 1535 Spaulding Rd Unit 463
- 1533 Spaulding Rd Unit 462
- 1539 Spaulding Rd
- 1537 Spaulding Rd Unit 464
- 1531 Spaulding Rd Unit 461
- 1569 Spaulding Rd Unit 485
Your Personal Tour Guide
Ask me questions while you tour the home.