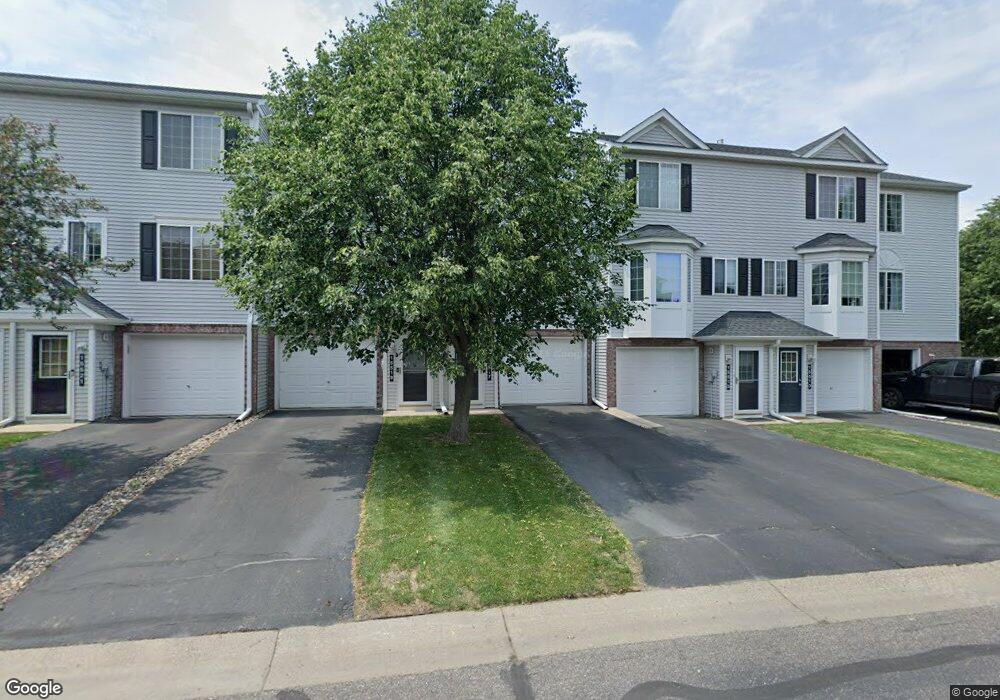
15517 Float Ln Unit 148 Saint Paul, MN 55124
Downtown Apple Valley NeighborhoodEstimated Value: $215,000 - $226,000
2
Beds
2
Baths
926
Sq Ft
$236/Sq Ft
Est. Value
About This Home
This home is located at 15517 Float Ln Unit 148, Saint Paul, MN 55124 and is currently estimated at $218,833, approximately $236 per square foot. 15517 Float Ln Unit 148 is a home located in Dakota County with nearby schools including Parkview Elementary School, Scott Highlands Middle School, and Rosemount Senior High School.
Ownership History
Date
Name
Owned For
Owner Type
Purchase Details
Closed on
Sep 28, 2018
Sold by
Gillispie Jameson and Gillispie Annemarie
Bought by
Ryan Gerald
Current Estimated Value
Home Financials for this Owner
Home Financials are based on the most recent Mortgage that was taken out on this home.
Original Mortgage
$127,200
Interest Rate
4.5%
Mortgage Type
New Conventional
Purchase Details
Closed on
Oct 10, 2017
Sold by
S & S Properties Management Services Llc
Bought by
Gillispie Jameson and Gillispie Annemarie
Home Financials for this Owner
Home Financials are based on the most recent Mortgage that was taken out on this home.
Original Mortgage
$138,710
Interest Rate
3.82%
Mortgage Type
New Conventional
Purchase Details
Closed on
Apr 10, 2001
Sold by
Pulte Homes Of Minnesota Corp
Bought by
Hanson Carol J
Create a Home Valuation Report for This Property
The Home Valuation Report is an in-depth analysis detailing your home's value as well as a comparison with similar homes in the area
Home Values in the Area
Average Home Value in this Area
Purchase History
| Date | Buyer | Sale Price | Title Company |
|---|---|---|---|
| Ryan Gerald | $159,000 | Dca Title | |
| Gillispie Jameson | $143,000 | Trademark Title Services Inc | |
| Hanson Carol J | $96,445 | -- |
Source: Public Records
Mortgage History
| Date | Status | Borrower | Loan Amount |
|---|---|---|---|
| Open | Ryan Gerald | $130,200 | |
| Closed | Ryan Gerald | $126,750 | |
| Closed | Ryan Gerald | $127,200 | |
| Previous Owner | Gillispie Jameson | $138,710 | |
| Previous Owner | Harson Carol J | $138,750 |
Source: Public Records
Tax History Compared to Growth
Tax History
| Year | Tax Paid | Tax Assessment Tax Assessment Total Assessment is a certain percentage of the fair market value that is determined by local assessors to be the total taxable value of land and additions on the property. | Land | Improvement |
|---|---|---|---|---|
| 2023 | $2,204 | $194,200 | $28,800 | $165,400 |
| 2022 | $1,908 | $185,600 | $27,500 | $158,100 |
| 2021 | $1,858 | $163,900 | $24,700 | $139,200 |
| 2020 | $1,794 | $156,000 | $23,500 | $132,500 |
| 2019 | $1,323 | $146,100 | $22,000 | $124,100 |
| 2018 | $1,225 | $131,800 | $19,800 | $112,000 |
| 2017 | $1,488 | $119,800 | $18,000 | $101,800 |
| 2016 | $1,390 | $114,400 | $17,200 | $97,200 |
| 2015 | $1,103 | $105,600 | $15,900 | $89,700 |
| 2014 | -- | $84,400 | $12,700 | $71,700 |
| 2013 | -- | $65,900 | $9,900 | $56,000 |
Source: Public Records
Map
Nearby Homes
- 15525 Float Ln Unit 152
- 15548 Float Ln Unit 104
- 6574 154th St W Unit 118
- 15646 Float Ct
- 6440 157th St W
- 15332 Floret Way
- 15359 Foliage Ave Unit 501
- 15716 Fox Cir
- 15720 Fox Cir
- 15481 Frost Path Unit 1803
- 15425 Frost Path Unit 1403
- 15653 Fjord Ave
- 15273 Florist Cir Unit 21
- 15711 France Way Unit 1211
- 15682 Fjord Ave
- 15594 Finch Ave
- 15752 Flackwood Ave Unit 154
- 15778 Flackwood Ave Unit 102
- 6881 158th St W
- 7070 153rd St W Unit 211
- 15517 Float Ln
- 15517 Float Ln
- 15515 Float Ln
- 15515 Float Ln Unit 147
- 15519 Float Ln Unit 149
- 15513 Float Ln
- 15513 Float Ln
- 15513 Float Ln Unit 146
- 15521 Float Ln Unit 150
- 15521 Float Ln
- 15511 Float Ln
- 15523 Float Ln
- 15523 Float Ln Unit 151
- 15527 Float Ln Unit 153
- 15529 Float Ln Unit 154
- 15531 Float Ln Unit 155
- 15541 Flight Way Unit 168
- 15533 Float Ln
- 15533 Float Ln Unit 156
- 15533 15533 Float Ln