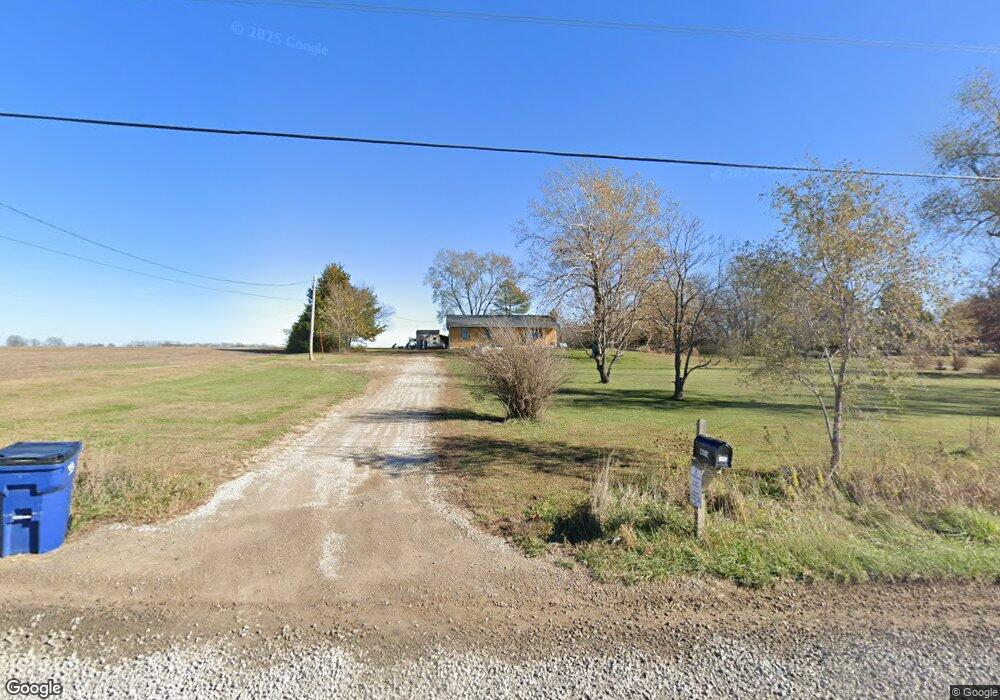
1552 E 800th Rd Lawrence, KS 66049
Estimated Value: $266,000 - $369,000
3
Beds
2
Baths
1,200
Sq Ft
$257/Sq Ft
Est. Value
About This Home
This home is located at 1552 E 800th Rd, Lawrence, KS 66049 and is currently estimated at $308,137, approximately $256 per square foot. 1552 E 800th Rd is a home located in Douglas County with nearby schools including Langston Hughes Elementary School, Southwest Middle School, and Lawrence Free State High School.
Ownership History
Date
Name
Owned For
Owner Type
Purchase Details
Closed on
Nov 29, 2021
Sold by
Miller Korinn A
Bought by
Martin Joshua T
Current Estimated Value
Home Financials for this Owner
Home Financials are based on the most recent Mortgage that was taken out on this home.
Original Mortgage
$168,000
Outstanding Balance
$154,474
Interest Rate
3.09%
Mortgage Type
New Conventional
Estimated Equity
$153,663
Purchase Details
Closed on
Aug 29, 2014
Sold by
Lanning James C
Bought by
Lanning Korrin A
Purchase Details
Closed on
Jan 29, 2009
Sold by
Williams Catherine Clara
Bought by
Lanning James C and Lanning Korinn A
Home Financials for this Owner
Home Financials are based on the most recent Mortgage that was taken out on this home.
Original Mortgage
$108,007
Interest Rate
4.92%
Mortgage Type
FHA
Create a Home Valuation Report for This Property
The Home Valuation Report is an in-depth analysis detailing your home's value as well as a comparison with similar homes in the area
Purchase History
| Date | Buyer | Sale Price | Title Company |
|---|---|---|---|
| Martin Joshua T | -- | Lawyers Title | |
| Lanning Korrin A | -- | None Available | |
| Lanning James C | -- | Commerce Title |
Source: Public Records
Mortgage History
| Date | Status | Borrower | Loan Amount |
|---|---|---|---|
| Open | Martin Joshua T | $168,000 | |
| Previous Owner | Lanning James C | $108,007 |
Source: Public Records
Tax History
| Year | Tax Paid | Tax Assessment Tax Assessment Total Assessment is a certain percentage of the fair market value that is determined by local assessors to be the total taxable value of land and additions on the property. | Land | Improvement |
|---|---|---|---|---|
| 2025 | $3,023 | $27,381 | $3,857 | $23,524 |
| 2024 | $2,835 | $25,749 | $3,794 | $21,955 |
| 2023 | $2,795 | $24,150 | $3,667 | $20,483 |
| 2022 | $2,825 | $24,150 | $3,414 | $20,736 |
| 2021 | $1,853 | $15,410 | $3,389 | $12,021 |
| 2020 | $1,730 | $14,490 | $3,389 | $11,101 |
| 2019 | $1,644 | $13,800 | $3,338 | $10,462 |
| 2018 | $1,606 | $13,386 | $3,258 | $10,128 |
| 2017 | $1,646 | $13,501 | $3,258 | $10,243 |
| 2016 | $1,447 | $12,326 | $1,392 | $10,934 |
| 2015 | $1,519 | $12,832 | $1,392 | $11,440 |
| 2014 | $1,437 | $12,269 | $1,392 | $10,877 |
Source: Public Records
Map
Nearby Homes
- 843 N 1500 Rd
- 5616 Maggie Way
- Lot 2 N Running Ridge Rd
- 5901 Maggie Way
- 1115 Klein Ct
- 916 Silver Rain Rd
- 1532B Legend Trail Dr
- 1549 Legend Trail Dr Unit A
- 927 N 1464 Rd
- 835 N 1710 Rd
- 1639 George Williams Way
- 5714 Silverstone Dr
- 1651 George Williams Way
- 5800 Johnson Dr
- 5806 Johnson Dr
- 5802 Johnson Dr
- 5629 Johnson Dr
- 5617 Johnson Dr
- 5802 Three Forks Ct
- 5524 Chamney Ct
- 1552 E 800 Rd
- 1548 E 800th Rd
- 0000 E 800
- 1565 E 800th Rd
- 785 N 1550 Rd
- Lot 3 E 800 Rd
- 1582 E 800th Rd
- Lot 2 N 1550 Rd
- 818 N 1500 Rd
- 1518 E 800th Rd
- 787 Highway 40
- 1508 E 800th Rd
- 1508 E 800 Rd
- 1505 E 800th Rd
- 822 N 1500 Rd
- 1504 E 800th Rd
- Lot 1 N 1550 Rd
- 0000 N 1500 Rd
- 50 m/l Acres N 1500 Rd
- 785 Highway 40
Your Personal Tour Guide
Ask me questions while you tour the home.