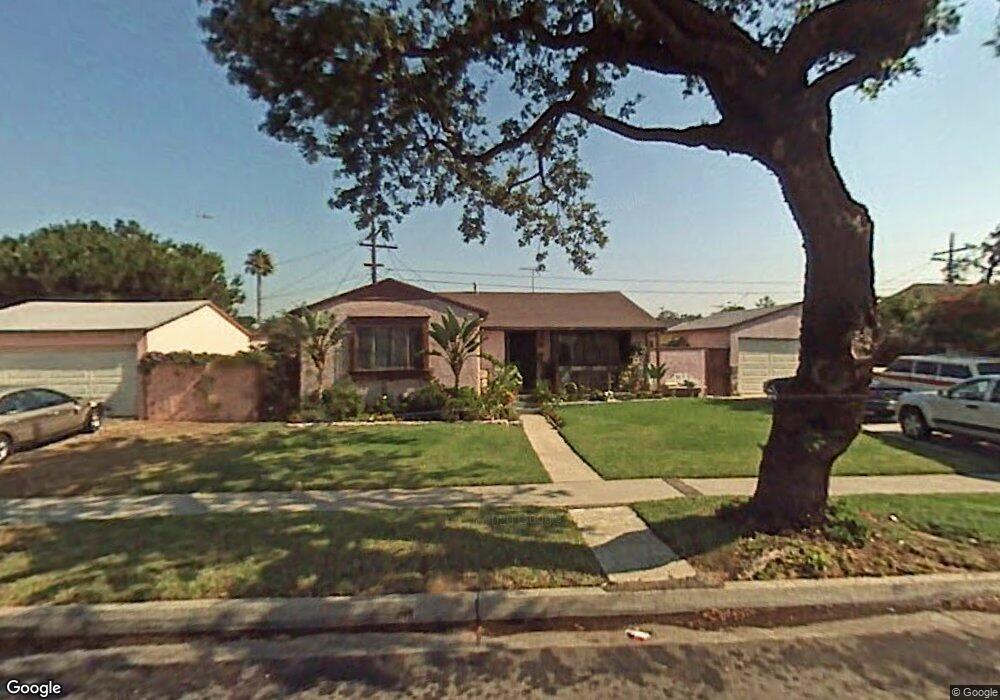
1553 W 111th Place Los Angeles, CA 90047
Estimated Value: $709,045 - $732,000
3
Beds
1
Bath
1,184
Sq Ft
$612/Sq Ft
Est. Value
About This Home
This home is located at 1553 W 111th Place, Los Angeles, CA 90047 and is currently estimated at $724,761, approximately $612 per square foot. 1553 W 111th Place is a home located in Los Angeles County with nearby schools including Century Park Elementary School, George Washington Preparatory High School, and Stella High Charter Academy.
Ownership History
Date
Name
Owned For
Owner Type
Purchase Details
Closed on
Sep 4, 2009
Sold by
Villalpando Ramiro
Bought by
Dela O Blanca Estela
Current Estimated Value
Purchase Details
Closed on
Sep 16, 2004
Sold by
Porter Melva L
Bought by
Villalpando Ramiro
Home Financials for this Owner
Home Financials are based on the most recent Mortgage that was taken out on this home.
Original Mortgage
$255,600
Interest Rate
6.5%
Mortgage Type
New Conventional
Purchase Details
Closed on
Dec 15, 1999
Sold by
Va
Bought by
Porter Melva L
Home Financials for this Owner
Home Financials are based on the most recent Mortgage that was taken out on this home.
Original Mortgage
$140,000
Interest Rate
7.68%
Mortgage Type
Seller Take Back
Purchase Details
Closed on
Feb 25, 1999
Sold by
Norwest Mtg Inc
Bought by
Va
Purchase Details
Closed on
Feb 24, 1999
Sold by
Holmon William L
Bought by
Norwest Mtg Inc
Create a Home Valuation Report for This Property
The Home Valuation Report is an in-depth analysis detailing your home's value as well as a comparison with similar homes in the area
Home Values in the Area
Average Home Value in this Area
Purchase History
| Date | Buyer | Sale Price | Title Company |
|---|---|---|---|
| Dela O Blanca Estela | -- | None Available | |
| Villalpando Ramiro | $319,500 | Landsafe Title | |
| Porter Melva L | $140,000 | First American Title Co | |
| Va | -- | Fidelity National Title Ins | |
| Norwest Mtg Inc | $112,684 | Fidelity National Title Ins |
Source: Public Records
Mortgage History
| Date | Status | Borrower | Loan Amount |
|---|---|---|---|
| Previous Owner | Villalpando Ramiro | $255,600 | |
| Previous Owner | Porter Melva L | $140,000 | |
| Closed | Villalpando Ramiro | $63,900 |
Source: Public Records
Tax History Compared to Growth
Tax History
| Year | Tax Paid | Tax Assessment Tax Assessment Total Assessment is a certain percentage of the fair market value that is determined by local assessors to be the total taxable value of land and additions on the property. | Land | Improvement |
|---|---|---|---|---|
| 2025 | $5,816 | $445,334 | $356,273 | $89,061 |
| 2024 | $5,816 | $436,603 | $349,288 | $87,315 |
| 2023 | $5,719 | $428,043 | $342,440 | $85,603 |
| 2022 | $5,454 | $419,651 | $335,726 | $83,925 |
| 2021 | $5,395 | $411,424 | $329,144 | $82,280 |
| 2020 | $5,436 | $407,207 | $325,770 | $81,437 |
| 2019 | $5,228 | $399,224 | $319,383 | $79,841 |
| 2018 | $5,139 | $391,397 | $313,121 | $78,276 |
| 2016 | $4,521 | $342,000 | $272,000 | $70,000 |
| 2015 | $4,510 | $342,000 | $272,000 | $70,000 |
| 2014 | $4,051 | $296,700 | $236,300 | $60,400 |
Source: Public Records
Map
Nearby Homes
- 11119 S Denker Ave
- 1519 W 111th St
- 1559 W 113th St
- 1445 W 110th Place
- 1424 W 113th St
- 1723 W 111th St
- 11100 S Normandie Ave
- 1616 W 108th St
- 1655 W 109th St
- 11143 Van Buren Ave
- 11137 7 van Buren Ave
- 1461 W 108th St
- 1303 W 109th Place
- 1520 W 107th St
- 11139 S Manhattan Place
- 11126 Van Buren Ave
- 1650 W 107th St
- 1609 W 107th St
- 11414 S Budlong Ave Unit 8
- 11700 S Normandie Ave
- 1545 W 111th Place
- 1554 W 111th St
- 1561 W 111th Place
- 1548 W 111th St
- 1562 W 111th St
- 1539 W 111th Place
- 1544 W 111th St
- 1552 W 111th Place
- 1546 W 111th Place
- 1556 W 111th Place
- 1542 W 111th Place
- 1538 W 111th St
- 1562 W 111th Place
- 1533 W 111th Place
- 1536 W 111th Place Unit 4
- 1536 W 111th Place
- 1532 W 111th St
- 1557 W 111th St
- 1553 W 111th St
- 1563 W 111th St