1554 Agnew St Simi Valley, CA 93065
West Simi Valley NeighborhoodEstimated Value: $682,000 - $743,000
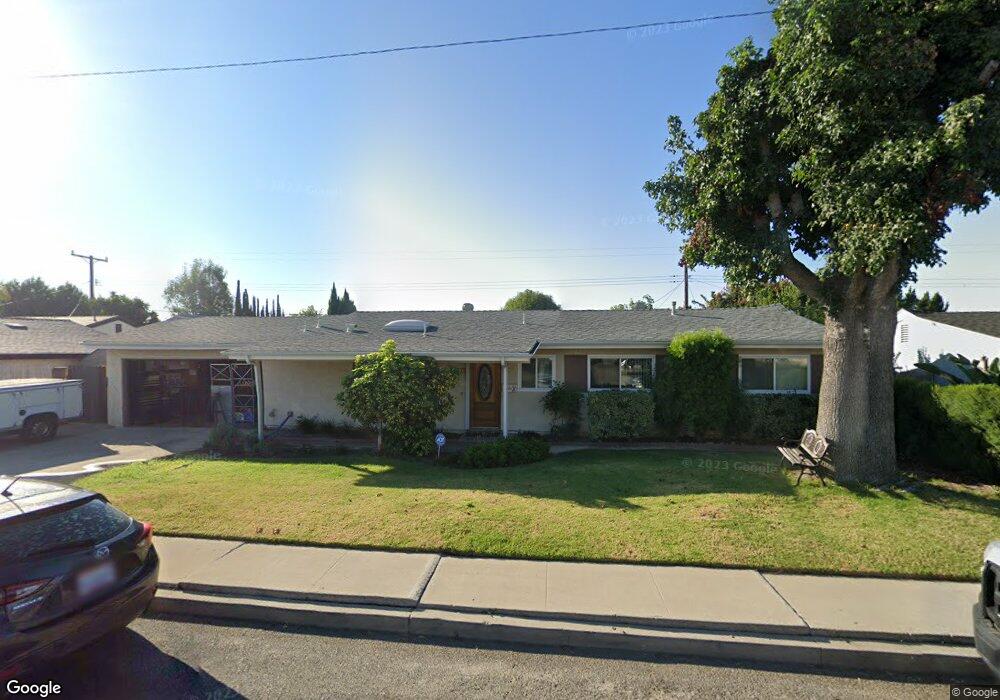
About This Home
This home is located at 1554 Agnew St, Simi Valley, CA 93065 and is currently estimated at $717,109, approximately $584 per square foot. 1554 Agnew St is a home located in Ventura County with nearby schools including Park View Elementary School, Sinaloa Middle School, and Royal High School.
Ownership History
We collect this data history from publicly available records. To have your information removed, we recommend requesting removal directly through your county’s website.
Purchase Details
Home Financials for this Owner
Home Financials are based on the most recent Mortgage that was taken out on this home.Purchase Details
Home Values in the Area
Average Home Value in this Area
Purchase History
We collect this data history from publicly available records. To have your information removed, we recommend requesting removal directly through your county’s website.
| Date | Buyer | Sale Price | Title Company |
|---|---|---|---|
| -- | Fidelity National Title | ||
| -- | -- |
Mortgage History
We collect this data history from publicly available records. To have your information removed, we recommend requesting removal directly through your county’s website.
| Date | Status | Borrower | Loan Amount |
|---|---|---|---|
| Closed | $210,000 |
Tax History
We collect this data history from publicly available records. To have your information removed, we recommend requesting removal directly through your county’s website.
| Year | Tax Paid | Tax Assessment Tax Assessment Total Assessment is a certain percentage of the fair market value that is determined by local assessors to be the total taxable value of land and additions on the property. | Land | Improvement |
|---|---|---|---|---|
| 2025 | $3,150 | $227,101 | $71,032 | $156,069 |
| 2024 | $3,150 | $222,649 | $69,640 | $153,009 |
| 2023 | $2,958 | $218,284 | $68,275 | $150,009 |
| 2022 | $2,921 | $214,004 | $66,936 | $147,068 |
| 2021 | $2,876 | $209,808 | $65,623 | $144,185 |
| 2020 | $2,801 | $207,658 | $64,951 | $142,707 |
| 2019 | $2,669 | $203,587 | $63,678 | $139,909 |
| 2018 | $2,631 | $199,596 | $62,430 | $137,166 |
| 2017 | $2,560 | $195,683 | $61,206 | $134,477 |
| 2016 | $2,440 | $191,847 | $60,006 | $131,841 |
| 2015 | $2,376 | $188,966 | $59,105 | $129,861 |
| 2014 | $2,328 | $185,267 | $57,949 | $127,318 |
Map
- 1554 Ahart St
- 1441 Ahart St
- 1662 Ahart St
- 2515 Callahan Ave
- 1490 Anderson St
- 1748 Ahart St
- 1608 Alviso St
- 2311 Marvel Ave
- 2476 Chandler Ave Unit 4
- 2506 Chandler Ave Unit 255
- 1692 Alviso St
- 1253 Tivoli Ln Unit 29
- 1230 Tivoli Ln Unit 224
- 1182 Tivoli Ln Unit 195
- 1868 Cloud Ct
- 1816 Hillary Ct
- 1159 Tivoli Ln Unit 85
- 1142 Tivoli Ln Unit 166
- 1158 Tivoli Ln Unit 172
- 2731 Erringer Rd Unit 86
Ask me questions while you tour the home.