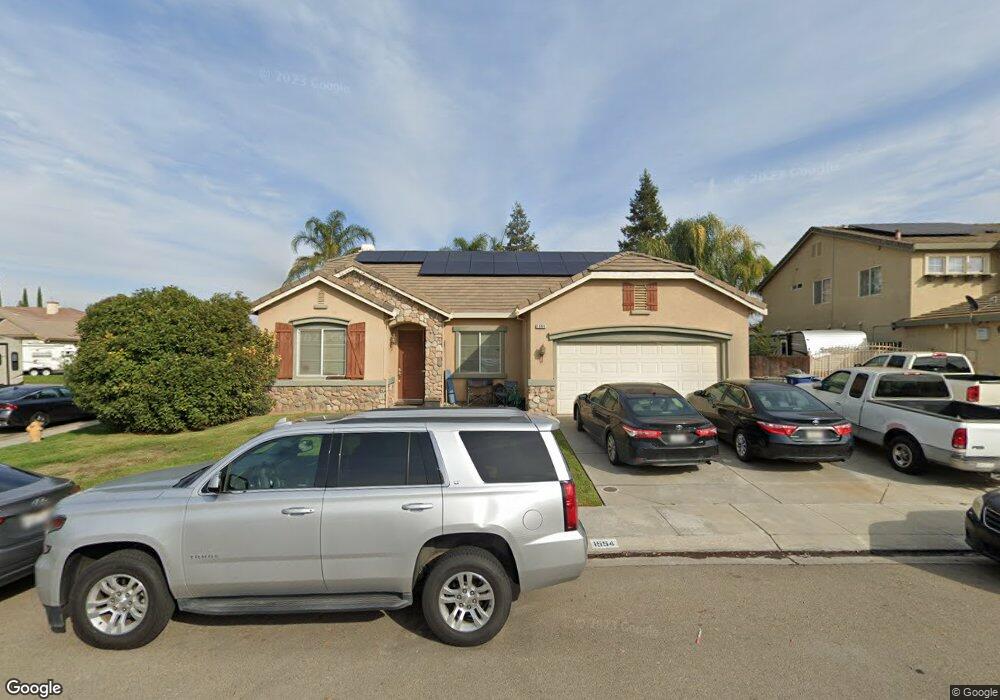
1554 Sage Sparrow Ave Manteca, CA 95337
Estimated Value: $478,000 - $652,000
3
Beds
2
Baths
1,993
Sq Ft
$296/Sq Ft
Est. Value
About This Home
This home is located at 1554 Sage Sparrow Ave, Manteca, CA 95337 and is currently estimated at $590,206, approximately $296 per square foot. 1554 Sage Sparrow Ave is a home located in San Joaquin County with nearby schools including Veritas Elementary School and Sierra High School.
Ownership History
Date
Name
Owned For
Owner Type
Purchase Details
Closed on
Mar 28, 2017
Sold by
Cook Erma and Perryman Gloria
Bought by
Cook Erma L and Perryman Gloria J
Current Estimated Value
Home Financials for this Owner
Home Financials are based on the most recent Mortgage that was taken out on this home.
Original Mortgage
$30,000
Outstanding Balance
$24,923
Interest Rate
4.15%
Mortgage Type
Purchase Money Mortgage
Estimated Equity
$565,283
Purchase Details
Closed on
Mar 1, 2013
Sold by
Cook Erma
Bought by
Perryman Gloria
Purchase Details
Closed on
May 6, 2002
Sold by
Meritage Homes Of Northern Ca Inc
Bought by
Cook Erma L
Home Financials for this Owner
Home Financials are based on the most recent Mortgage that was taken out on this home.
Original Mortgage
$219,100
Interest Rate
6.89%
Create a Home Valuation Report for This Property
The Home Valuation Report is an in-depth analysis detailing your home's value as well as a comparison with similar homes in the area
Home Values in the Area
Average Home Value in this Area
Purchase History
| Date | Buyer | Sale Price | Title Company |
|---|---|---|---|
| Cook Erma L | -- | North American Title Co Inc | |
| Perryman Gloria | -- | None Available | |
| Cook Erma L | $274,000 | North American Title Co |
Source: Public Records
Mortgage History
| Date | Status | Borrower | Loan Amount |
|---|---|---|---|
| Open | Cook Erma L | $30,000 | |
| Previous Owner | Cook Erma L | $219,100 |
Source: Public Records
Tax History Compared to Growth
Tax History
| Year | Tax Paid | Tax Assessment Tax Assessment Total Assessment is a certain percentage of the fair market value that is determined by local assessors to be the total taxable value of land and additions on the property. | Land | Improvement |
|---|---|---|---|---|
| 2025 | $5,329 | $404,602 | $121,130 | $283,472 |
| 2024 | $5,203 | $396,669 | $118,755 | $277,914 |
| 2023 | $5,095 | $388,892 | $116,427 | $272,465 |
| 2022 | $5,030 | $381,268 | $114,145 | $267,123 |
| 2021 | $4,980 | $373,793 | $111,907 | $261,886 |
| 2020 | $4,809 | $369,961 | $110,760 | $259,201 |
| 2019 | $4,750 | $362,708 | $108,589 | $254,119 |
| 2018 | $4,671 | $355,597 | $106,460 | $249,137 |
| 2017 | $4,616 | $348,625 | $104,373 | $244,252 |
| 2016 | $4,546 | $341,791 | $102,327 | $239,464 |
| 2014 | $4,238 | $326,000 | $98,000 | $228,000 |
Source: Public Records
Map
Nearby Homes
- 1565 Blue Lupine Ln
- 1957 W Woodward Ave
- 1747 Gladwall Ave
- 1602 Oleander Ave
- 1770 Ettle St
- 1630 Red Ribbons Ln
- 2214 Milano St
- 1635 Langum Way
- 1749 Mary Augusta St
- Residence 1 Plan at Heston at Machado Ranch - Heston
- Residence 3 Plan at Heston at Machado Ranch - Heston
- Residence 1 Plan at Machado Ranch - Eastwood
- Residence 4 Plan at Machado Ranch - Eastwood
- Residence 2 Plan at Machado Ranch - Eastwood
- Residence 3 Plan at Machado Ranch - Eastwood
- Residence 2 Plan at Heston at Machado Ranch - Heston
- Residence 4 Plan at Heston at Machado Ranch - Heston
- 1877 Lateral Ave
- 2377 Emma Dr
- 2372 Emma Dr
- 1562 Sage Sparrow Ave
- 1557 Nighthawk Ln
- 1561 Nighthawk Ln
- 1989 Purple Sage Way
- 1567 Nighthawk Ln
- 1570 Sage Sparrow Ave
- 1557 Sage Sparrow Ave
- 1545 Sage Sparrow Ave
- 1977 Purple Sage Way
- 1565 Sage Sparrow Ave
- 1571 Nighthawk Ln
- 1539 Sage Sparrow Ave
- 1576 Sage Sparrow Ave
- 1963 Purple Sage Way
- 1573 Sage Sparrow Ave
- 1992 Goldfinch Way
- 1533 Sage Sparrow Ave
- 1558 Nighthawk Ln
- 1562 Nighthawk Ln
- 1572 Purple Martin Ln