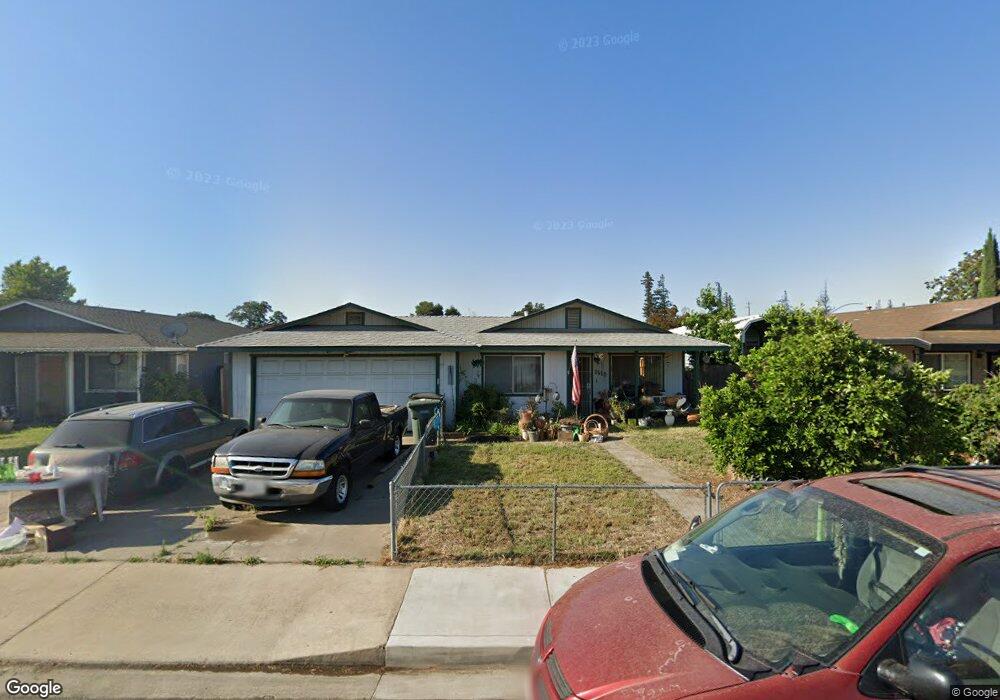
1555 Pontiac St Oakdale, CA 95361
Estimated Value: $262,000 - $415,000
3
Beds
2
Baths
1,140
Sq Ft
$325/Sq Ft
Est. Value
About This Home
This home is located at 1555 Pontiac St, Oakdale, CA 95361 and is currently estimated at $370,828, approximately $325 per square foot. 1555 Pontiac St is a home located in Stanislaus County with nearby schools including Fair Oaks Elementary School, Oakdale Junior High School, and East Stanislaus High School.
Ownership History
Date
Name
Owned For
Owner Type
Purchase Details
Closed on
Apr 1, 2025
Sold by
Magann Debra K and Magann Kenneth Gary
Bought by
Magann Deborah K
Current Estimated Value
Purchase Details
Closed on
Jul 13, 1999
Sold by
Thompson Brian John
Bought by
Magann Kenneth Gary and Magann Ann E
Home Financials for this Owner
Home Financials are based on the most recent Mortgage that was taken out on this home.
Original Mortgage
$78,400
Interest Rate
7.64%
Purchase Details
Closed on
Jun 25, 1999
Sold by
Jane Kelley Mary J and Jane Mary
Bought by
Thompson Brian John
Home Financials for this Owner
Home Financials are based on the most recent Mortgage that was taken out on this home.
Original Mortgage
$78,400
Interest Rate
7.64%
Purchase Details
Closed on
Jan 11, 1999
Sold by
Kelley Mary J
Bought by
Thompson Brian John
Purchase Details
Closed on
Dec 1, 1993
Sold by
Kelley Allen R and Kelley Mary J
Bought by
Kelley Mary J
Create a Home Valuation Report for This Property
The Home Valuation Report is an in-depth analysis detailing your home's value as well as a comparison with similar homes in the area
Home Values in the Area
Average Home Value in this Area
Purchase History
| Date | Buyer | Sale Price | Title Company |
|---|---|---|---|
| Magann Deborah K | -- | None Listed On Document | |
| Magann Kenneth Gary | $98,000 | Stewart Title | |
| Thompson Brian John | -- | Stewart Title | |
| Thompson Brian John | -- | -- | |
| Kelley Mary J | -- | -- |
Source: Public Records
Mortgage History
| Date | Status | Borrower | Loan Amount |
|---|---|---|---|
| Previous Owner | Magann Kenneth Gary | $78,400 |
Source: Public Records
Tax History Compared to Growth
Tax History
| Year | Tax Paid | Tax Assessment Tax Assessment Total Assessment is a certain percentage of the fair market value that is determined by local assessors to be the total taxable value of land and additions on the property. | Land | Improvement |
|---|---|---|---|---|
| 2025 | $1,603 | $150,601 | $49,941 | $100,660 |
| 2024 | $1,518 | $147,649 | $48,962 | $98,687 |
| 2023 | $1,485 | $144,754 | $48,002 | $96,752 |
| 2022 | $1,458 | $141,916 | $47,061 | $94,855 |
| 2021 | $1,433 | $139,135 | $46,139 | $92,996 |
| 2020 | $1,416 | $137,709 | $45,666 | $92,043 |
| 2019 | $1,393 | $135,010 | $44,771 | $90,239 |
| 2018 | $1,372 | $132,364 | $43,894 | $88,470 |
| 2017 | $1,347 | $129,770 | $43,034 | $86,736 |
| 2016 | $1,322 | $127,227 | $42,191 | $85,036 |
| 2015 | $1,304 | $125,317 | $41,558 | $83,759 |
| 2014 | $1,291 | $122,863 | $40,744 | $82,119 |
Source: Public Records
Map
Nearby Homes
- 1342 Pontiac St
- 1625 Valmor Ct
- 166 Stanislaus Ave
- 64 School Ave
- 1948 Sugar Pine Dr
- 1105 W G St
- 1972 Sugar Pine Dr
- 24 N Bryan Ave
- 1601 W J St
- 15 Willowood Dr
- 140 Blankenship Ave
- 2295 Pontiac St
- 491 Nicholas Ct
- 557 Stetson Dr
- 2337 Rainwood Ln
- 562 Ranger St
- 1863 Vintage Cir
- 596 Hudson Ave
- 2306 W F St
- 1766 Churchill Downs Cir
- 1533 Pontiac St
- 1577 Pontiac St
- 1515 Pontiac St
- 49 N Lee Ave
- 1599 Pontiac St
- 1477 Pontiac St
- 1554 Pontiac St
- 1576 Pontiac St
- 1501 Pontiac St
- 1532 Pontiac St
- 67 N Lee Ave
- 1453 Pontiac St
- 1486 Pontiac St
- 85 N Lee Ave
- 1462 Pontiac St
- 1431 Pontiac St
- 50 N Lee Ave
- 1605 Pontiac St
- 1602 Valmor Ct
- 1430 Pontiac St