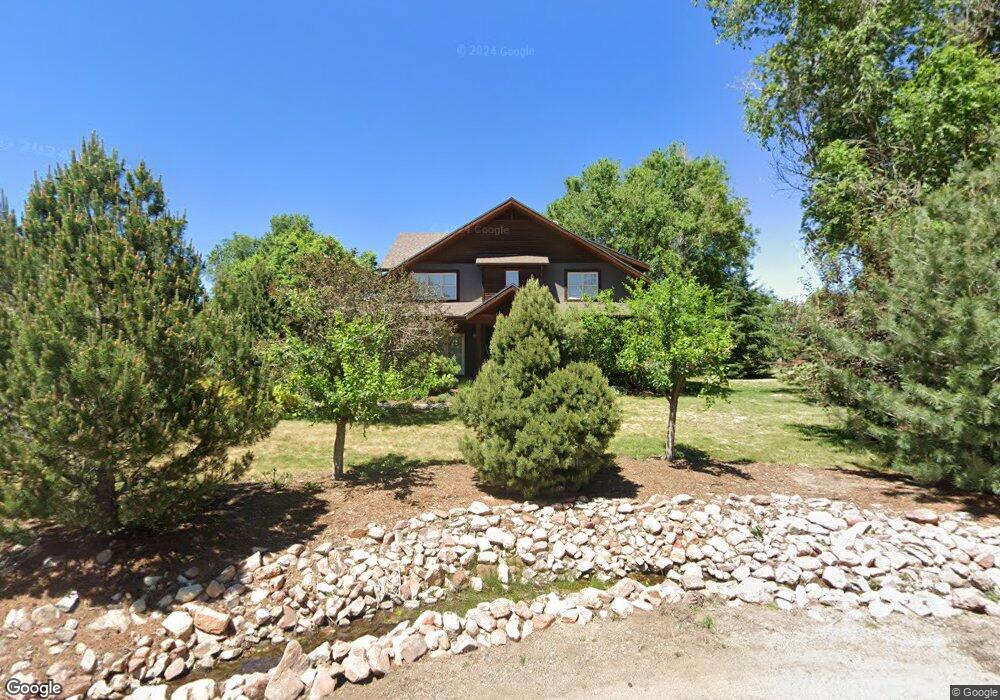
1555 Tamarack Ave Boulder, CO 80304
North Boulder NeighborhoodEstimated Value: $2,324,000 - $2,855,000
6
Beds
4
Baths
3,983
Sq Ft
$648/Sq Ft
Est. Value
About This Home
This home is located at 1555 Tamarack Ave, Boulder, CO 80304 and is currently estimated at $2,582,484, approximately $648 per square foot. 1555 Tamarack Ave is a home located in Boulder County with nearby schools including Crest View Elementary School, Centennial Middle School, and Boulder High School.
Ownership History
Date
Name
Owned For
Owner Type
Purchase Details
Closed on
Oct 20, 2010
Sold by
Brown William H and Brown Margot W
Bought by
Knowles Andrew
Current Estimated Value
Home Financials for this Owner
Home Financials are based on the most recent Mortgage that was taken out on this home.
Original Mortgage
$725,000
Outstanding Balance
$475,982
Interest Rate
4.25%
Mortgage Type
New Conventional
Estimated Equity
$2,106,502
Purchase Details
Closed on
Jul 10, 2002
Sold by
Portman John Stewart and Wymore David D
Bought by
Brown William H
Purchase Details
Closed on
Apr 3, 1993
Bought by
Knowles Andrew and Knowles Jill
Purchase Details
Closed on
Sep 3, 1986
Bought by
Knowles Andrew and Knowles Jill
Purchase Details
Closed on
Dec 13, 1983
Bought by
Knowles Andrew and Knowles Jill
Purchase Details
Closed on
Sep 13, 1976
Bought by
Knowles Andrew and Knowles Jill
Create a Home Valuation Report for This Property
The Home Valuation Report is an in-depth analysis detailing your home's value as well as a comparison with similar homes in the area
Home Values in the Area
Average Home Value in this Area
Purchase History
| Date | Buyer | Sale Price | Title Company |
|---|---|---|---|
| Knowles Andrew | $1,070,000 | Heritage Title | |
| Brown William H | $425,000 | -- | |
| Knowles Andrew | -- | -- | |
| Knowles Andrew | $100 | -- | |
| Knowles Andrew | $120,000 | -- | |
| Knowles Andrew | $11,000 | -- |
Source: Public Records
Mortgage History
| Date | Status | Borrower | Loan Amount |
|---|---|---|---|
| Open | Knowles Andrew | $725,000 |
Source: Public Records
Tax History
| Year | Tax Paid | Tax Assessment Tax Assessment Total Assessment is a certain percentage of the fair market value that is determined by local assessors to be the total taxable value of land and additions on the property. | Land | Improvement |
|---|---|---|---|---|
| 2025 | $14,804 | $152,688 | $73,369 | $79,319 |
| 2024 | $14,804 | $152,688 | $73,369 | $79,319 |
| 2023 | $14,547 | $168,451 | $75,844 | $96,292 |
| 2022 | $11,759 | $126,629 | $61,188 | $65,441 |
| 2021 | $11,213 | $130,273 | $62,949 | $67,324 |
| 2020 | $9,290 | $106,728 | $56,628 | $50,100 |
| 2019 | $9,148 | $106,728 | $56,628 | $50,100 |
| 2018 | $8,409 | $96,991 | $41,832 | $55,159 |
| 2017 | $8,146 | $107,230 | $46,248 | $60,982 |
| 2016 | $7,212 | $83,317 | $39,402 | $43,915 |
| 2015 | $6,830 | $73,256 | $33,034 | $40,222 |
| 2014 | $6,159 | $73,256 | $33,034 | $40,222 |
Source: Public Records
Map
Nearby Homes
- 1560 Sumac Ave
- 1800 Sumac Ave
- 1205 Sumac Ave
- 1801 Redwood Ave
- 4500 19th St Unit 111
- 4500 19th St
- 4500 19th St Unit 178
- 4371 Broadway
- 1170 Violet Ave
- 1160 Violet Ave
- 1150 Violet Ave
- 1140 Violet Ave
- 2116 Vine Ave
- 2126 Vine Ave
- 1090 Locust Ave
- 1130 Violet Ave
- 1120 Violet Ave
- 1040 Locust Ave
- 4520 Broadway St Unit 207
- 1487 Periwinkle Dr
- 1545 Tamarack Ave
- 1591 Tamarack Ave
- 1570 Upland Ave
- 1535 Tamarack Ave
- 1590 Upland Ave
- 1560 Upland Ave
- 1570 Tamarack Ave
- 1550 Tamarack Ave
- 1590 Tamarack Ave
- 1540 Tamarack Ave
- 1502 Upland Ave
- 1530 Tamarack Ave
- 1565 Sumac Ave
- 1595 Sumac Ave
- 1555 Sumac Ave
- 1510 Tamarack Ave
- 1527 Sumac Ave
- 1500 Upland Ave
- 1545 Upland Ave
- 1525 Sumac Ave
Your Personal Tour Guide
Ask me questions while you tour the home.