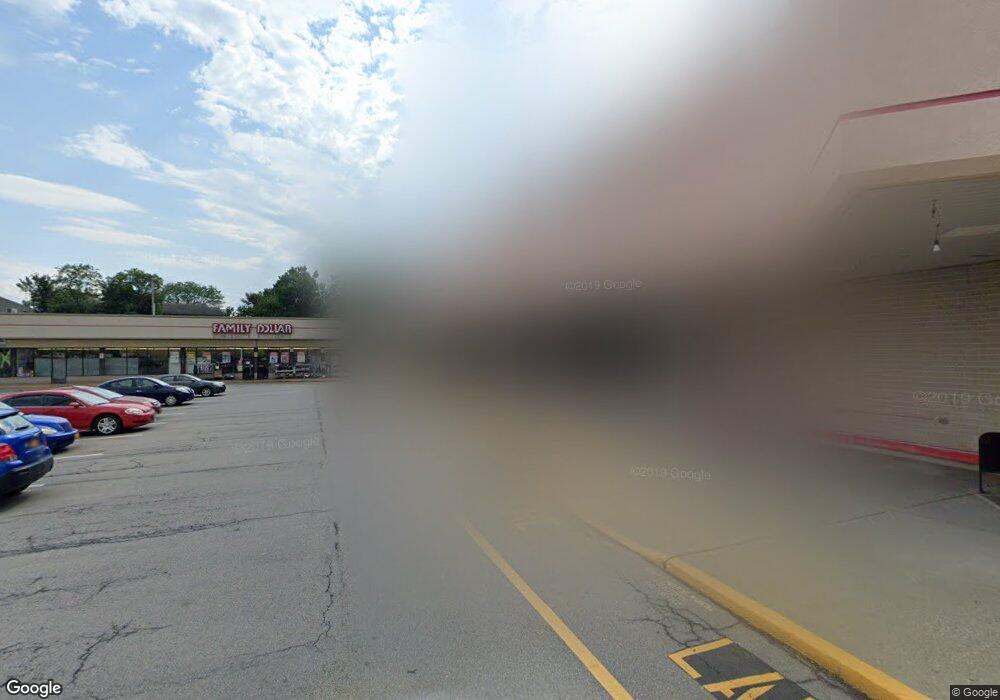
156 Dolson Ave Middletown, NY 10940
Estimated Value: $8,286,380
--
Bed
--
Bath
54,065
Sq Ft
$153/Sq Ft
Est. Value
About This Home
This home is located at 156 Dolson Ave, Middletown, NY 10940 and is currently estimated at $8,286,380, approximately $153 per square foot. 156 Dolson Ave is a home located in Orange County with nearby schools including Middletown Twin Towers Middle School, Monhagen Middle School, and Middletown High School.
Ownership History
Date
Name
Owned For
Owner Type
Purchase Details
Closed on
Dec 12, 2017
Sold by
Csmc 27-C1 Dolson Ave Llc
Bought by
Middletown Plaza Holdings
Current Estimated Value
Home Financials for this Owner
Home Financials are based on the most recent Mortgage that was taken out on this home.
Original Mortgage
$2,900,000
Outstanding Balance
$2,442,177
Interest Rate
3.95%
Mortgage Type
Purchase Money Mortgage
Estimated Equity
$5,844,203
Purchase Details
Closed on
Jul 22, 2014
Sold by
Specthrie Mark
Bought by
Dolson Csmc 2007-C1 and Avenue Associates, Llc
Purchase Details
Closed on
Aug 14, 2000
Sold by
Jo Ren Company
Bought by
Regency Svgs Bank Fsb
Create a Home Valuation Report for This Property
The Home Valuation Report is an in-depth analysis detailing your home's value as well as a comparison with similar homes in the area
Home Values in the Area
Average Home Value in this Area
Purchase History
| Date | Buyer | Sale Price | Title Company |
|---|---|---|---|
| Middletown Plaza Holdings | $4,025,000 | -- | |
| Dolson Csmc 2007-C1 | $11,556,901 | Maureen Bass | |
| Regency Svgs Bank Fsb | $12,200,000 | -- |
Source: Public Records
Mortgage History
| Date | Status | Borrower | Loan Amount |
|---|---|---|---|
| Open | Middletown Plaza Holdings | $2,900,000 |
Source: Public Records
Tax History Compared to Growth
Tax History
| Year | Tax Paid | Tax Assessment Tax Assessment Total Assessment is a certain percentage of the fair market value that is determined by local assessors to be the total taxable value of land and additions on the property. | Land | Improvement |
|---|---|---|---|---|
| 2024 | $104,273 | $622,125 | $60,000 | $562,125 |
| 2023 | $104,273 | $622,125 | $60,000 | $562,125 |
| 2022 | $107,543 | $622,125 | $60,000 | $562,125 |
| 2021 | $113,846 | $622,125 | $60,000 | $562,125 |
| 2020 | $66,433 | $622,125 | $60,000 | $562,125 |
| 2019 | $107,322 | $888,700 | $60,000 | $828,700 |
| 2018 | $177,986 | $950,000 | $60,000 | $890,000 |
| 2017 | $237,933 | $1,300,000 | $60,000 | $1,240,000 |
| 2016 | $224,664 | $1,300,000 | $60,000 | $1,240,000 |
| 2015 | -- | $1,300,000 | $60,000 | $1,240,000 |
| 2014 | -- | $1,300,000 | $60,000 | $1,240,000 |
Source: Public Records
Map
Nearby Homes