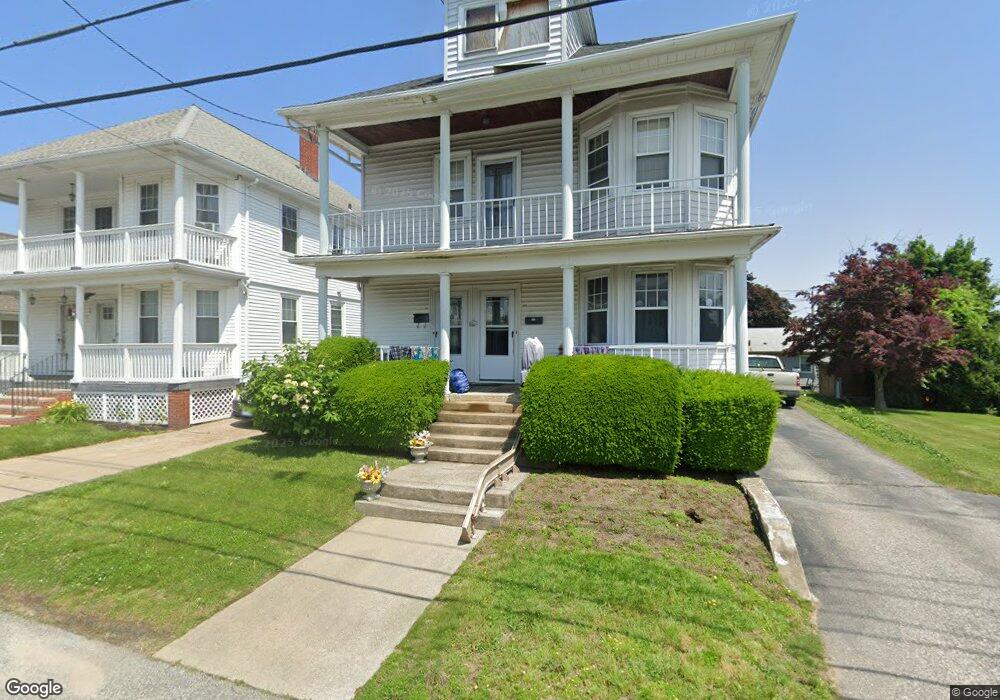
156 Maplewood Ave Cranston, RI 02920
Arlington NeighborhoodEstimated Value: $431,767 - $565,000
6
Beds
2
Baths
2,282
Sq Ft
$221/Sq Ft
Est. Value
About This Home
This home is located at 156 Maplewood Ave, Cranston, RI 02920 and is currently estimated at $504,442, approximately $221 per square foot. 156 Maplewood Ave is a home located in Providence County with nearby schools including Hugh B. Bain Middle School, Cranston High School East, and Achievement First Iluminar Mayoral Academy.
Ownership History
Date
Name
Owned For
Owner Type
Purchase Details
Closed on
Sep 26, 2018
Sold by
Angelina Fallago Ret 2
Bought by
Fallago Richard P
Current Estimated Value
Home Financials for this Owner
Home Financials are based on the most recent Mortgage that was taken out on this home.
Original Mortgage
$70,000
Outstanding Balance
$60,918
Interest Rate
4.5%
Mortgage Type
Adjustable Rate Mortgage/ARM
Estimated Equity
$443,524
Purchase Details
Closed on
Apr 14, 2017
Sold by
Amy Realty Rigp
Bought by
Angela Fallago T
Purchase Details
Closed on
Apr 30, 2014
Sold by
Fallago Angelina
Bought by
Fallago Richard
Purchase Details
Closed on
Apr 22, 2014
Sold by
Fallago Angelina
Bought by
Angelina Fallago Ret
Purchase Details
Closed on
May 13, 2013
Sold by
Fallago Angelina
Bought by
Fallago Angelina
Create a Home Valuation Report for This Property
The Home Valuation Report is an in-depth analysis detailing your home's value as well as a comparison with similar homes in the area
Home Values in the Area
Average Home Value in this Area
Purchase History
| Date | Buyer | Sale Price | Title Company |
|---|---|---|---|
| Fallago Richard P | -- | -- | |
| Angela Fallago T | $6,265 | -- | |
| Fallago Richard | -- | -- | |
| Angelina Fallago Ret | -- | -- | |
| Fallago Angelina | -- | -- |
Source: Public Records
Mortgage History
| Date | Status | Borrower | Loan Amount |
|---|---|---|---|
| Open | Fallago Angelina | $70,000 | |
| Previous Owner | Fallago Angelina | $159,300 | |
| Previous Owner | Fallago Angelina | $50,000 |
Source: Public Records
Tax History
| Year | Tax Paid | Tax Assessment Tax Assessment Total Assessment is a certain percentage of the fair market value that is determined by local assessors to be the total taxable value of land and additions on the property. | Land | Improvement |
|---|---|---|---|---|
| 2025 | $5,172 | $372,600 | $83,900 | $288,700 |
| 2024 | $5,071 | $372,600 | $83,900 | $288,700 |
| 2023 | $4,871 | $257,700 | $57,900 | $199,800 |
| 2022 | $4,770 | $257,700 | $57,900 | $199,800 |
| 2021 | $4,639 | $257,700 | $57,900 | $199,800 |
| 2020 | $4,218 | $203,100 | $45,000 | $158,100 |
| 2019 | $4,218 | $203,100 | $45,000 | $158,100 |
| 2018 | $4,121 | $203,100 | $45,000 | $158,100 |
| 2017 | $3,647 | $159,000 | $35,400 | $123,600 |
| 2016 | $3,570 | $159,000 | $35,400 | $123,600 |
Source: Public Records
Map
Nearby Homes
- 62 Browne St
- 78 Wales St
- 293 Webster Ave
- 27 What Cheer Ave
- 11 Hillhurst Ave
- 95 Elwyn St
- 161 Prudence Ave
- 27 Moorefield St
- 79 Priscilla Ave
- 193 Clarence St
- 36 Moorefield St Unit 38
- 620 Union Ave
- 51 Old Oak Ave
- 0 Princess Ave
- 66 Progress Ave
- 30 Lark Ave
- 92 Old Oak Ave
- 68 Murray St
- 649 Union Ave
- 4 Priscilla Ave
- 154 Maplewood Ave Unit 1
- 152 Maplewood Ave
- 148 Maplewood Ave
- 166 Maplewood Ave
- 48 Wakefield Ave
- 40 Wakefield Ave
- 418 Laurel Hill Ave
- 434 Laurel Hill Ave
- 168 Maplewood Ave
- 155 Maplewood Ave
- 416 Laurel Hill Ave
- 151 Maplewood Ave
- 151 Maplewood Ave Unit 2
- 446 Laurel Hill Ave
- 34 Wakefield Ave
- 165 Maplewood Ave
- 174 Maplewood Ave
- 45 Wakefield Ave
- 39 Wakefield Ave
- 169 Maplewood Ave
Your Personal Tour Guide
Ask me questions while you tour the home.