Estimated Value: $402,000 - $558,000
4
Beds
3
Baths
1,811
Sq Ft
$274/Sq Ft
Est. Value
About This Home
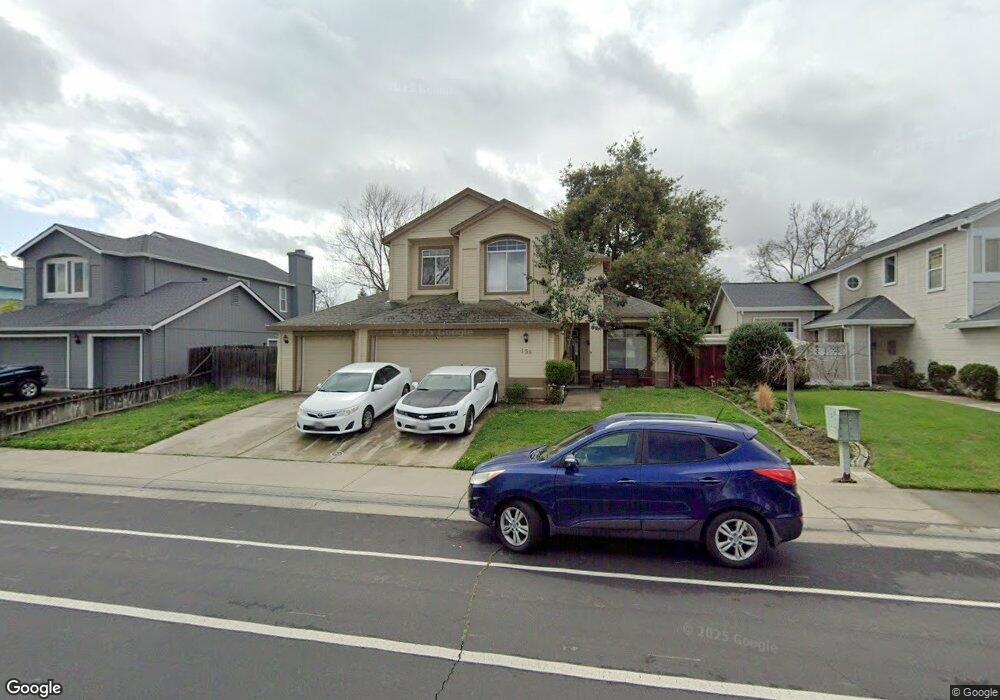
This home is located at 156 W C St, Galt, CA 95632 and is currently estimated at $496,175, approximately $273 per square foot. 156 W C St is a home located in Sacramento County with nearby schools including Valley Oaks Elementary School, Robert L. McCaffrey Middle School, and Galt High School.
Ownership History
Date
Name
Owned For
Owner Type
Purchase Details
Closed on
Nov 28, 2012
Sold by
Tibbetts Kevin Charles and Tibbetts Dorene Marie
Bought by
Thr California Lp
Current Estimated Value
Purchase Details
Closed on
Feb 23, 1999
Sold by
Bice Gordon L and Bice Wendy S
Bought by
Tibbetts Kevin Charles and Tibbetts Dorene Marie
Home Financials for this Owner
Home Financials are based on the most recent Mortgage that was taken out on this home.
Original Mortgage
$139,070
Interest Rate
6.78%
Mortgage Type
FHA
Purchase Details
Closed on
May 8, 1996
Sold by
Camp Theresa S and Camp Steven J
Bought by
Bice Gordon L and Bice Wendy S
Home Financials for this Owner
Home Financials are based on the most recent Mortgage that was taken out on this home.
Original Mortgage
$138,906
Interest Rate
7.8%
Mortgage Type
FHA
Create a Home Valuation Report for This Property
The Home Valuation Report is an in-depth analysis detailing your home's value as well as a comparison with similar homes in the area
Home Values in the Area
Average Home Value in this Area
Purchase History
| Date | Buyer | Sale Price | Title Company |
|---|---|---|---|
| Thr California Lp | $177,000 | None Available | |
| Tibbetts Kevin Charles | $140,000 | Sacramento Title Company | |
| Bice Gordon L | $141,000 | North American Title Co |
Source: Public Records
Mortgage History
| Date | Status | Borrower | Loan Amount |
|---|---|---|---|
| Previous Owner | Tibbetts Kevin Charles | $139,070 | |
| Previous Owner | Bice Gordon L | $138,906 |
Source: Public Records
Tax History Compared to Growth
Tax History
| Year | Tax Paid | Tax Assessment Tax Assessment Total Assessment is a certain percentage of the fair market value that is determined by local assessors to be the total taxable value of land and additions on the property. | Land | Improvement |
|---|---|---|---|---|
| 2025 | $3,916 | $336,563 | $92,843 | $243,720 |
| 2024 | $3,916 | $329,965 | $91,023 | $238,942 |
| 2023 | $3,854 | $323,496 | $89,239 | $234,257 |
| 2022 | $3,707 | $317,154 | $87,490 | $229,664 |
| 2021 | $4,130 | $310,936 | $85,775 | $225,161 |
| 2020 | $4,101 | $307,749 | $84,896 | $222,853 |
| 2019 | $4,015 | $301,716 | $83,232 | $218,484 |
| 2018 | $2,547 | $167,746 | $32,466 | $135,280 |
| 2017 | $2,472 | $164,458 | $31,830 | $132,628 |
| 2016 | $2,400 | $161,234 | $31,206 | $130,028 |
| 2015 | $2,339 | $158,813 | $30,738 | $128,075 |
| 2014 | $2,335 | $155,703 | $30,136 | $125,567 |
Source: Public Records
Map
Nearby Homes