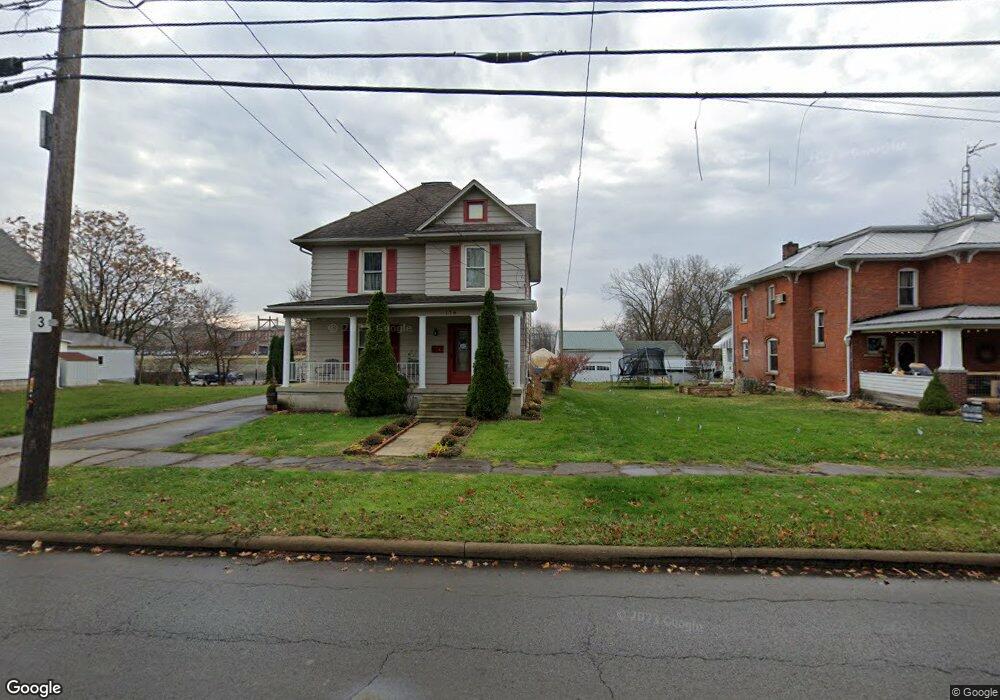
156 W Main St Shelby, OH 44875
Estimated Value: $135,000 - $146,000
4
Beds
1
Bath
1,686
Sq Ft
$83/Sq Ft
Est. Value
About This Home
This home is located at 156 W Main St, Shelby, OH 44875 and is currently estimated at $140,271, approximately $83 per square foot. 156 W Main St is a home located in Richland County with nearby schools including St. Mary's School.
Ownership History
Date
Name
Owned For
Owner Type
Purchase Details
Closed on
May 21, 2021
Sold by
Aji Properties Of Mansfield Llc
Bought by
Uyoa Victor and Uyoa Veronica
Current Estimated Value
Purchase Details
Closed on
May 20, 2021
Sold by
Aji Properties Of Mansfield Llc
Bought by
Uyoa Victor and Uyoa Veronica
Purchase Details
Closed on
Dec 13, 2019
Sold by
Merwine Larry
Bought by
Aji Properties Of Mansfield Llc
Purchase Details
Closed on
May 7, 2015
Sold by
Wells Fargo Bank Na
Bought by
Merwine Larry
Purchase Details
Closed on
Mar 17, 2015
Sold by
Stepp James M and Case #2012 Cv 0408
Bought by
Wells Fargo Bank Na
Purchase Details
Closed on
Mar 3, 2003
Sold by
Riley John
Bought by
Stepp James M
Home Financials for this Owner
Home Financials are based on the most recent Mortgage that was taken out on this home.
Original Mortgage
$80,634
Interest Rate
6.07%
Mortgage Type
FHA
Purchase Details
Closed on
Jul 9, 2002
Sold by
Shrf Allen Armstrong Pr
Bought by
Riley John and Riley Brent
Create a Home Valuation Report for This Property
The Home Valuation Report is an in-depth analysis detailing your home's value as well as a comparison with similar homes in the area
Home Values in the Area
Average Home Value in this Area
Purchase History
| Date | Buyer | Sale Price | Title Company |
|---|---|---|---|
| Uyoa Victor | $42,400 | Hawkins Title Research | |
| Uyoa Victor | -- | Hawkins Title | |
| Aji Properties Of Mansfield Llc | -- | None Available | |
| Merwine Larry | $29,300 | Linear Title & Closing | |
| Wells Fargo Bank Na | $14,000 | Attorney | |
| Stepp James M | $81,900 | -- | |
| Riley John | $53,000 | -- |
Source: Public Records
Mortgage History
| Date | Status | Borrower | Loan Amount |
|---|---|---|---|
| Previous Owner | Stepp James M | $80,634 |
Source: Public Records
Tax History
| Year | Tax Paid | Tax Assessment Tax Assessment Total Assessment is a certain percentage of the fair market value that is determined by local assessors to be the total taxable value of land and additions on the property. | Land | Improvement |
|---|---|---|---|---|
| 2024 | $1,243 | $33,390 | $4,550 | $28,840 |
| 2023 | $1,276 | $33,390 | $4,550 | $28,840 |
| 2022 | $707 | $16,560 | $4,610 | $11,950 |
| 2021 | $708 | $16,560 | $4,610 | $11,950 |
| 2020 | $726 | $16,560 | $4,610 | $11,950 |
| 2019 | $673 | $14,080 | $3,900 | $10,180 |
| 2018 | $841 | $17,760 | $7,580 | $10,180 |
| 2017 | $650 | $17,510 | $3,790 | $13,720 |
| 2016 | $479 | $10,280 | $3,600 | $6,680 |
| 2015 | $1,236 | $26,630 | $3,600 | $23,030 |
| 2014 | $1,163 | $26,630 | $3,600 | $23,030 |
| 2012 | $602 | $28,030 | $3,790 | $24,240 |
Source: Public Records
Map
Nearby Homes
Your Personal Tour Guide
Ask me questions while you tour the home.