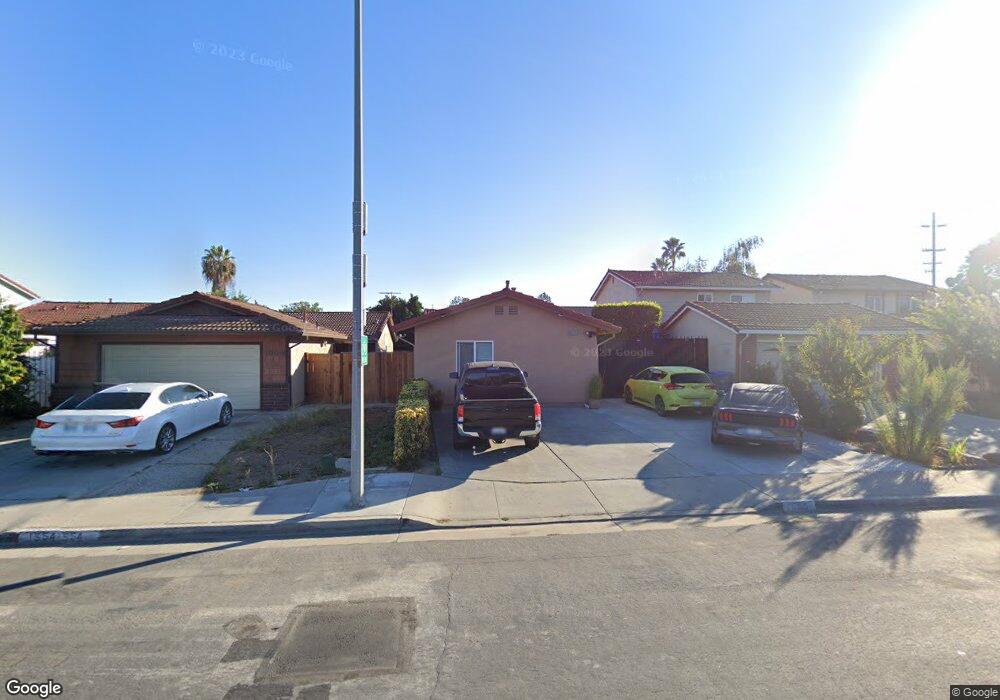
1560 Roberts Ave San Jose, CA 95122
Kennedy NeighborhoodEstimated Value: $888,000 - $1,016,000
3
Beds
2
Baths
815
Sq Ft
$1,159/Sq Ft
Est. Value
About This Home
This home is located at 1560 Roberts Ave, San Jose, CA 95122 and is currently estimated at $944,635, approximately $1,159 per square foot. 1560 Roberts Ave is a home located in Santa Clara County with nearby schools including Robert F. Kennedy Elementary School, Sylvandale Middle School, and Yerba Buena High School.
Ownership History
Date
Name
Owned For
Owner Type
Purchase Details
Closed on
Mar 17, 2003
Sold by
Balleza Julia
Bought by
Munoz Jorge L Balleza
Current Estimated Value
Home Financials for this Owner
Home Financials are based on the most recent Mortgage that was taken out on this home.
Original Mortgage
$184,000
Interest Rate
5.79%
Mortgage Type
Purchase Money Mortgage
Purchase Details
Closed on
Nov 10, 1998
Sold by
Dellinger Ricky Lee R and Dellinger Beverly G
Bought by
Munoz Jorge L
Home Financials for this Owner
Home Financials are based on the most recent Mortgage that was taken out on this home.
Original Mortgage
$188,950
Interest Rate
6.42%
Mortgage Type
Purchase Money Mortgage
Purchase Details
Closed on
Aug 17, 1995
Sold by
Oppus Tomas L
Bought by
Dellinger Ricky Lee R and Dellinger Beverly G
Home Financials for this Owner
Home Financials are based on the most recent Mortgage that was taken out on this home.
Original Mortgage
$138,700
Interest Rate
7.71%
Create a Home Valuation Report for This Property
The Home Valuation Report is an in-depth analysis detailing your home's value as well as a comparison with similar homes in the area
Home Values in the Area
Average Home Value in this Area
Purchase History
| Date | Buyer | Sale Price | Title Company |
|---|---|---|---|
| Munoz Jorge L Balleza | -- | Alliance Title Company | |
| Munoz Jorge L Balleza | -- | Alliance Title Company | |
| Munoz Jorge L | $210,000 | Financial Title Company | |
| Dellinger Ricky Lee R | $146,000 | Chicago Title |
Source: Public Records
Mortgage History
| Date | Status | Borrower | Loan Amount |
|---|---|---|---|
| Closed | Munoz Jorge L Balleza | $184,000 | |
| Closed | Munoz Jorge L | $188,950 | |
| Previous Owner | Dellinger Ricky Lee R | $138,700 |
Source: Public Records
Tax History Compared to Growth
Tax History
| Year | Tax Paid | Tax Assessment Tax Assessment Total Assessment is a certain percentage of the fair market value that is determined by local assessors to be the total taxable value of land and additions on the property. | Land | Improvement |
|---|---|---|---|---|
| 2025 | $6,891 | $410,907 | $172,433 | $238,474 |
| 2024 | $6,891 | $402,851 | $169,052 | $233,799 |
| 2023 | $6,768 | $394,953 | $165,738 | $229,215 |
| 2022 | $6,627 | $387,210 | $162,489 | $224,721 |
| 2021 | $5,387 | $304,128 | $159,303 | $144,825 |
| 2020 | $5,158 | $301,010 | $157,670 | $143,340 |
| 2019 | $4,945 | $295,109 | $154,579 | $140,530 |
| 2018 | $4,922 | $289,324 | $151,549 | $137,775 |
| 2017 | $4,852 | $283,652 | $148,578 | $135,074 |
| 2016 | $4,614 | $278,091 | $145,665 | $132,426 |
| 2015 | $4,517 | $273,914 | $143,477 | $130,437 |
| 2014 | $4,067 | $268,549 | $140,667 | $127,882 |
Source: Public Records
Map
Nearby Homes
- 835 Saraband Way
- 810 Vintage Way
- 963 Mills Corner Ln
- 1714 Bevin Brook Dr
- 1704 Bevin Brook Dr
- 988 Summerplace Dr
- 1887 Aberdeen Ct
- 1362 Mcquesten Dr Unit A
- 1231 Turtlerock Dr
- 1068 Summershore Ct
- 1087 Summerain Ct
- 2015 Tahiti Ct
- 1050 Summermist Ct
- 1042 Summermist Ct Unit 107
- 1117 Indian Summer Ct
- 2175 Summerton Dr
- 2102 Galveston Ave Unit A
- 2102 Galveston Ave Unit B
- 1550 Crucero Dr
- 1381 Taper Ct
- 1554 Roberts Ave
- 1566 Roberts Ave
- 1548 Roberts Ave
- 1572 Roberts Ave
- 1542 Roberts Ave
- 1597 Trieste Way
- 1593 Trieste Way
- 1578 Roberts Ave
- 1599 Trieste Way
- 1589 Trieste Way
- 1603 Trieste Way
- 1536 Roberts Ave
- 1585 Trieste Way
- 1607 Trieste Way
- 1581 Trieste Way
- 1530 Roberts Ave
- 1577 Trieste Way
- 1524 Roberts Ave
- 1573 Trieste Way
- 817 Oswego Dr