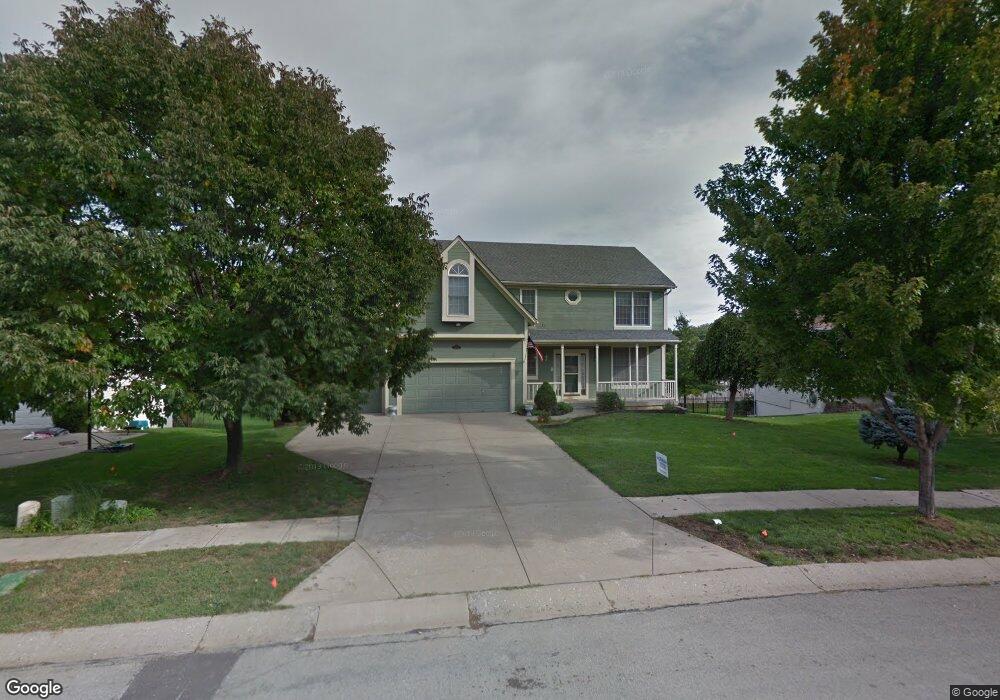
15602 W 80th St Lenexa, KS 66219
Estimated Value: $485,000 - $519,000
4
Beds
5
Baths
2,545
Sq Ft
$197/Sq Ft
Est. Value
About This Home
This home is located at 15602 W 80th St, Lenexa, KS 66219 and is currently estimated at $502,350, approximately $197 per square foot. 15602 W 80th St is a home located in Johnson County with nearby schools including Christa McAuliffe Elementary School, Westridge Middle School, and Shawnee Mission West High School.
Ownership History
Date
Name
Owned For
Owner Type
Purchase Details
Closed on
Jun 30, 2025
Sold by
Michael Daniel Weller Trust and Weller Michael
Bought by
Weller Michael Daniel and Laughlin Linda E
Current Estimated Value
Home Financials for this Owner
Home Financials are based on the most recent Mortgage that was taken out on this home.
Original Mortgage
$280,000
Outstanding Balance
$279,530
Interest Rate
6.89%
Mortgage Type
New Conventional
Estimated Equity
$222,820
Purchase Details
Closed on
May 8, 2014
Sold by
Weller Michael D
Bought by
Weller Michael Daniel
Purchase Details
Closed on
Sep 30, 2010
Sold by
Weller Michael D
Bought by
Weller Gabriella G
Purchase Details
Closed on
Jan 13, 2003
Sold by
Lapka Sondra K
Bought by
Weller Michael D and Weller Gabriella G
Home Financials for this Owner
Home Financials are based on the most recent Mortgage that was taken out on this home.
Original Mortgage
$152,360
Interest Rate
5.62%
Create a Home Valuation Report for This Property
The Home Valuation Report is an in-depth analysis detailing your home's value as well as a comparison with similar homes in the area
Home Values in the Area
Average Home Value in this Area
Purchase History
| Date | Buyer | Sale Price | Title Company |
|---|---|---|---|
| Weller Michael Daniel | -- | Servicelink | |
| Weller Michael Daniel | -- | Servicelink | |
| Weller Michael Daniel | -- | None Available | |
| Weller Gabriella G | -- | None Available | |
| Weller Michael D | -- | Chicago Title Insurance Co |
Source: Public Records
Mortgage History
| Date | Status | Borrower | Loan Amount |
|---|---|---|---|
| Open | Weller Michael Daniel | $280,000 | |
| Closed | Weller Michael Daniel | $280,000 | |
| Previous Owner | Weller Michael D | $152,360 |
Source: Public Records
Tax History Compared to Growth
Tax History
| Year | Tax Paid | Tax Assessment Tax Assessment Total Assessment is a certain percentage of the fair market value that is determined by local assessors to be the total taxable value of land and additions on the property. | Land | Improvement |
|---|---|---|---|---|
| 2024 | $5,873 | $52,981 | $11,298 | $41,683 |
| 2023 | $5,671 | $50,393 | $10,271 | $40,122 |
| 2022 | $5,335 | $47,380 | $9,336 | $38,044 |
| 2021 | $4,802 | $40,526 | $8,488 | $32,038 |
| 2020 | $4,475 | $37,363 | $8,488 | $28,875 |
| 2019 | $4,435 | $37,019 | $7,075 | $29,944 |
| 2018 | $4,515 | $37,375 | $7,075 | $30,300 |
| 2017 | $4,505 | $36,156 | $6,435 | $29,721 |
| 2016 | $4,297 | $34,052 | $5,854 | $28,198 |
| 2015 | $4,111 | $32,799 | $5,854 | $26,945 |
| 2013 | -- | $29,866 | $5,854 | $24,012 |
Source: Public Records
Map
Nearby Homes
- 8033 Hall St
- 15615 W 81st St
- 15322 W 83rd St
- 15529 W 83rd Terrace
- 15322 W 83rd Terrace
- 7621 Lichtenauer Dr
- 15710 W 84th Terrace
- 8403 Swarner Dr
- 14828 W 83rd Place
- 14915 W 84th Terrace
- 7219 Allman Rd
- 7239 Allman Rd
- 7221 Allman Rd
- 7237 Allman Rd
- 7231 Allman Rd
- 15611 W 86th St
- 8616 Baska Ct
- 16809 W 83rd St
- 14620 W 84th St
- 7229 Allman Dr
- 15612 W 80th St
- 15522 W 80th St
- 15605 W 79th Terrace
- 15516 W 80th St
- 15523 W 79th Terrace
- 15702 W 80th St
- 15603 W 80th St
- 15609 W 80th St
- 15611 W 79th Terrace
- 15517 W 79th Terrace
- 15521 W 80th St
- 7930 Hall St
- 15701 W 80th St
- 7924 Hall St
- 7905 Lakeview Ave
- 15515 W 80th St
- 7936 Hall St
- 15708 W 80th St
- 7918 Hall St
- 7907 Lakeview Ave