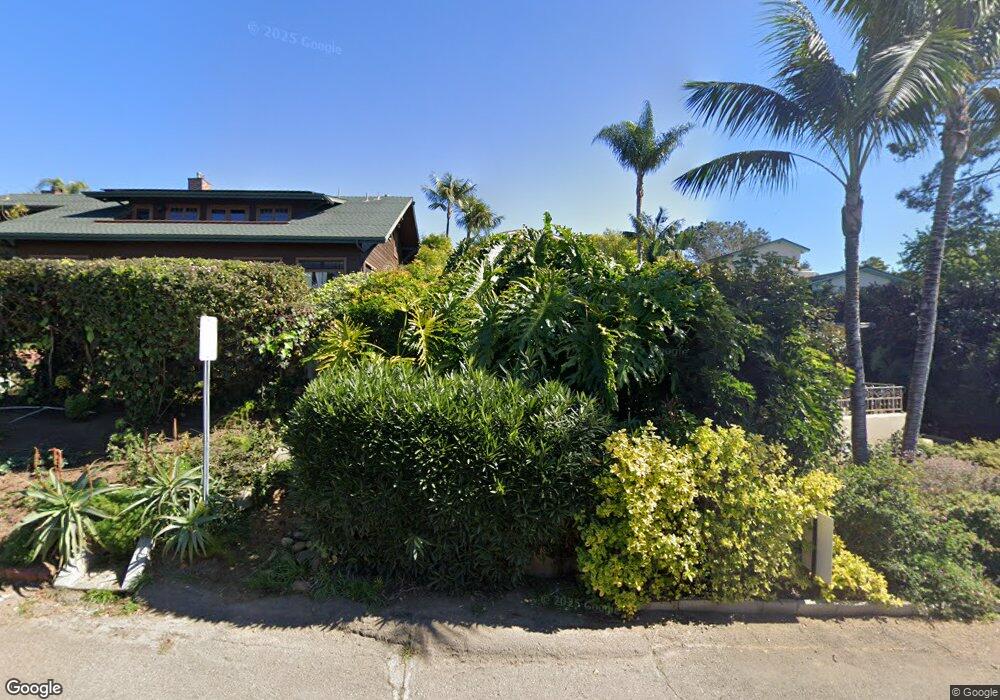
1563 Luneta Dr Del Mar, CA 92014
Estimated Value: $3,899,000 - $5,980,000
2
Beds
3
Baths
3,337
Sq Ft
$1,469/Sq Ft
Est. Value
About This Home
This home is located at 1563 Luneta Dr, Del Mar, CA 92014 and is currently estimated at $4,900,497, approximately $1,468 per square foot. 1563 Luneta Dr is a home located in San Diego County with nearby schools including Del Mar Heights School, Del Mar Hills Elementary School, and Earl Warren Middle School.
Ownership History
Date
Name
Owned For
Owner Type
Purchase Details
Closed on
Feb 21, 2014
Sold by
Bruderer Schwab Joe and Bruderer Schwab Cornelia Maria
Bought by
Bruderer Cornelia Maria
Current Estimated Value
Purchase Details
Closed on
Jun 9, 2000
Sold by
Combs Ingrid S and Siikov Ingrid
Bought by
Bruderer Schwab Joe and Bruderer Schwab Cornelia Maria
Purchase Details
Closed on
Nov 14, 1997
Sold by
Combs Ingrid S
Bought by
Combs Ingrid Siikov
Home Financials for this Owner
Home Financials are based on the most recent Mortgage that was taken out on this home.
Original Mortgage
$150,000
Interest Rate
3.95%
Purchase Details
Closed on
Feb 8, 1994
Sold by
Combs Richard M
Bought by
Combs Ingrid S
Purchase Details
Closed on
Jun 16, 1989
Purchase Details
Closed on
Apr 11, 1989
Purchase Details
Closed on
Feb 19, 1988
Purchase Details
Closed on
Dec 31, 1986
Create a Home Valuation Report for This Property
The Home Valuation Report is an in-depth analysis detailing your home's value as well as a comparison with similar homes in the area
Home Values in the Area
Average Home Value in this Area
Purchase History
| Date | Buyer | Sale Price | Title Company |
|---|---|---|---|
| Bruderer Cornelia Maria | -- | None Available | |
| Bruderer Schwab Joe | $1,100,000 | Commonwealth Title | |
| Combs Ingrid Siikov | -- | Southland Title | |
| Combs Ingrid S | -- | -- | |
| -- | $300,000 | -- | |
| -- | $300,000 | -- | |
| -- | $270,000 | -- | |
| -- | $219,000 | -- |
Source: Public Records
Mortgage History
| Date | Status | Borrower | Loan Amount |
|---|---|---|---|
| Previous Owner | Combs Ingrid Siikov | $150,000 |
Source: Public Records
Tax History Compared to Growth
Tax History
| Year | Tax Paid | Tax Assessment Tax Assessment Total Assessment is a certain percentage of the fair market value that is determined by local assessors to be the total taxable value of land and additions on the property. | Land | Improvement |
|---|---|---|---|---|
| 2025 | $26,850 | $2,566,058 | $1,596,403 | $969,655 |
| 2024 | $26,850 | $2,515,744 | $1,565,101 | $950,643 |
| 2023 | $26,259 | $2,466,416 | $1,534,413 | $932,003 |
| 2022 | $25,838 | $2,418,056 | $1,504,327 | $913,729 |
| 2021 | $24,883 | $2,370,644 | $1,474,831 | $895,813 |
| 2020 | $25,105 | $2,346,337 | $1,459,709 | $886,628 |
| 2019 | $24,611 | $2,300,332 | $1,431,088 | $869,244 |
| 2018 | $23,520 | $2,255,228 | $1,403,028 | $852,200 |
| 2017 | $23,076 | $2,211,009 | $1,375,518 | $835,491 |
| 2016 | $22,320 | $2,167,657 | $1,348,548 | $819,109 |
| 2015 | $21,985 | $2,135,098 | $1,328,292 | $806,806 |
| 2014 | $21,530 | $2,093,275 | $1,302,273 | $791,002 |
Source: Public Records
Map
Nearby Homes
- 1641 Stratford Way
- 1562 Camino Del Mar Unit 648
- 1562 Camino Del Mar Unit 643
- 386 13th St
- 421 Serpentine Dr
- 1722 Seaview Ave
- 1552 Camino Del Mar Unit 401
- 1407 Ocean Ave
- 000 Camino Del Mar
- 1859 Zapo St
- 320 Bellaire St
- 1716 Ocean Front
- 1141 Luneta Dr
- 1834 Ocean Front Unit 36
- 550 Amphitheatre Dr
- 2029 Balboa Ave
- 1943-45 Coast Blvd
- 555 Amphitheatre Dr
- 408 Luzon Ave
- 2026 Seaview Ave