Estimated Value: $417,500 - $472,000
5
Beds
3
Baths
1,432
Sq Ft
$310/Sq Ft
Est. Value
About This Home
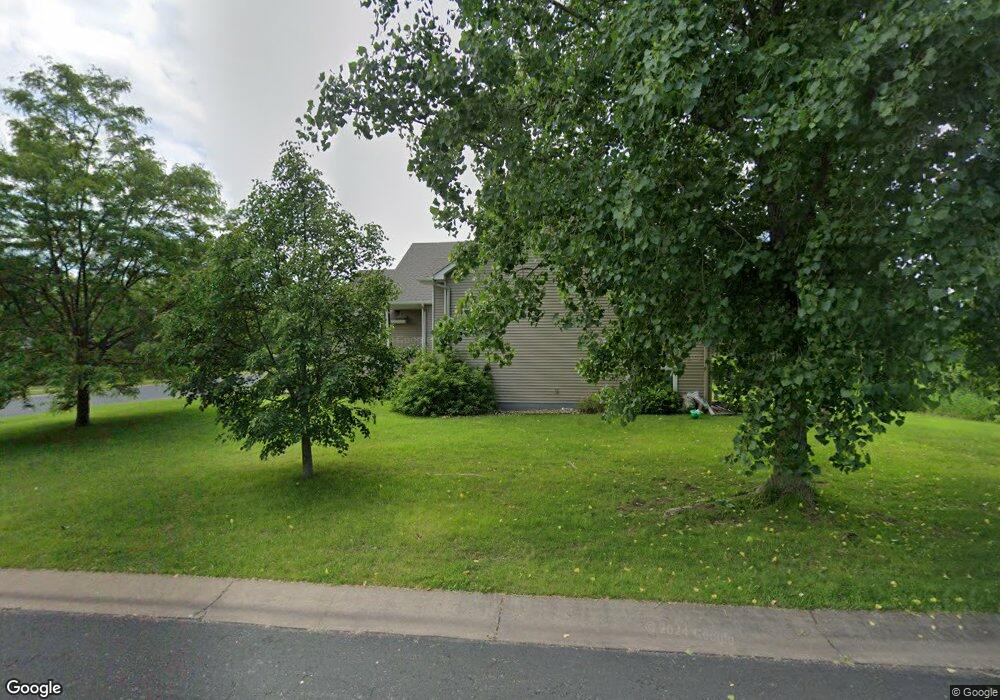
This home is located at 15630 Falcon Cir N, Hugo, MN 55038 and is currently estimated at $443,875, approximately $309 per square foot. 15630 Falcon Cir N is a home located in Washington County with nearby schools including Oneka Elementary School, Hugo Elementary School, and Central Middle School.
Ownership History
Date
Name
Owned For
Owner Type
Purchase Details
Closed on
Apr 29, 2022
Sold by
Peterson Christopher Mark
Bought by
Saaribovre Amy Carolyn
Current Estimated Value
Purchase Details
Closed on
Nov 30, 2015
Sold by
Suko Peter W and Baker Kristine M
Bought by
Peterson Christopher
Home Financials for this Owner
Home Financials are based on the most recent Mortgage that was taken out on this home.
Original Mortgage
$289,800
Interest Rate
3.88%
Mortgage Type
New Conventional
Purchase Details
Closed on
Dec 22, 2011
Sold by
Eternity Homes Llc
Bought by
Suko Peter W and Baker Kristine M
Home Financials for this Owner
Home Financials are based on the most recent Mortgage that was taken out on this home.
Original Mortgage
$205,650
Interest Rate
3.98%
Mortgage Type
New Conventional
Purchase Details
Closed on
Jan 24, 2005
Sold by
Waters Edge North Sf Llc
Bought by
Dave Schultz Const Llp
Create a Home Valuation Report for This Property
The Home Valuation Report is an in-depth analysis detailing your home's value as well as a comparison with similar homes in the area
Home Values in the Area
Average Home Value in this Area
Purchase History
| Date | Buyer | Sale Price | Title Company |
|---|---|---|---|
| Saaribovre Amy Carolyn | -- | None Listed On Document | |
| Peterson Christopher | $322,000 | Titlesmart Inc | |
| Suko Peter W | $228,500 | -- | |
| Dave Schultz Const Llp | $504,459 | -- |
Source: Public Records
Mortgage History
| Date | Status | Borrower | Loan Amount |
|---|---|---|---|
| Previous Owner | Peterson Christopher | $289,800 | |
| Previous Owner | Suko Peter W | $205,650 |
Source: Public Records
Tax History Compared to Growth
Tax History
| Year | Tax Paid | Tax Assessment Tax Assessment Total Assessment is a certain percentage of the fair market value that is determined by local assessors to be the total taxable value of land and additions on the property. | Land | Improvement |
|---|---|---|---|---|
| 2024 | $4,510 | $387,600 | $85,000 | $302,600 |
| 2023 | $4,510 | $434,700 | $120,000 | $314,700 |
| 2022 | $4,288 | $416,500 | $126,200 | $290,300 |
| 2021 | $4,310 | $346,500 | $105,000 | $241,500 |
| 2020 | $4,342 | $345,500 | $110,000 | $235,500 |
| 2019 | $3,696 | $334,300 | $100,000 | $234,300 |
| 2018 | $3,494 | $314,400 | $100,000 | $214,400 |
| 2017 | $3,202 | $305,300 | $95,000 | $210,300 |
| 2016 | $3,132 | $279,000 | $77,000 | $202,000 |
| 2015 | $3,216 | $259,700 | $63,900 | $195,800 |
| 2013 | -- | $227,800 | $50,000 | $177,800 |
Source: Public Records
Map
Nearby Homes
- 5082 157th St N
- 4905 Evergreen Dr N
- 4907 Evergreen Dr N
- 4901 Education Dr N
- 4840 Education Dr N
- 4838 Education Dr N
- 4831 Education Dr N
- 4798 Prairie Trail N
- 15895 Ethan Trail N
- 16109 Fairoaks Ave N
- 15220 Fanning Dr N
- 7536 Lotus Ln
- 7532 Lotus Ln
- 4590 Empress Way N
- 16036 Ethan Trail N
- 15911 Finale Ct N
- 15921 Finale Ct N
- 4845 Empress Ave N
- 15151 French Dr N
- 16123 Europa Ave N
- xxxx Falcon Cir N
- 15620 Falcon Cir N
- 5149 5149 157th-Street-n
- 5172 5172 157th-Street-n
- 5168 5168 157th-Street-n
- 5176 5176 157th-Street-n
- 5180 5180 157th-Street-n
- 5068 5068 157th-Street-n
- 5199 5199 157th-Street-n
- 5087 5087 157th-Street-n
- 5188 5188 157th-Street-n
- 5127 5127 157th-Street-n
- 5113 5113 157th-Street-n
- 15680 Fairoaks Ave N
- 15610 Falcon Cir N
- 5051 157th St N
- 15675 Fairoaks Ave N
- 15681 Fairoaks Ave N
- 15682 Fairoaks Ave N
- 5063 157th St N