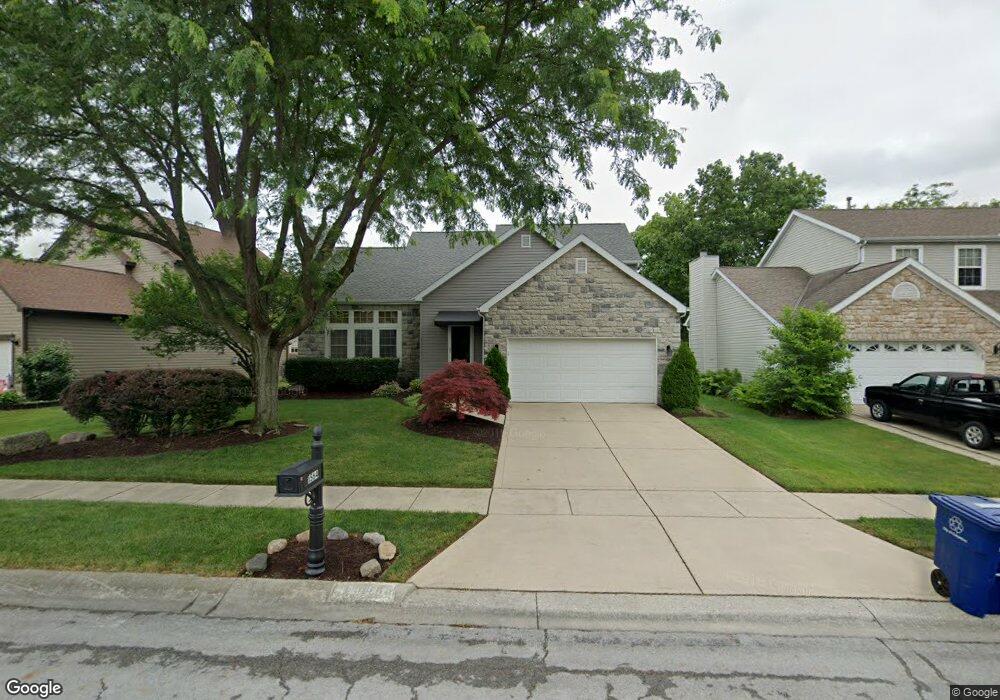
1564 Whitcombe Way Columbus, OH 43228
Scioto Woods NeighborhoodEstimated Value: $399,000 - $463,000
3
Beds
4
Baths
2,200
Sq Ft
$196/Sq Ft
Est. Value
About This Home
This home is located at 1564 Whitcombe Way, Columbus, OH 43228 and is currently estimated at $431,050, approximately $195 per square foot. 1564 Whitcombe Way is a home located in Franklin County with nearby schools including Galloway Ridge Intermediate School, Prairie Lincoln Elementary School, and Norton Middle School.
Ownership History
Date
Name
Owned For
Owner Type
Purchase Details
Closed on
Jun 30, 2010
Sold by
Bolyard Randall D and Bolyard Shellie L
Bought by
Hughes Ronald G and Hughes Jeanne M
Current Estimated Value
Home Financials for this Owner
Home Financials are based on the most recent Mortgage that was taken out on this home.
Original Mortgage
$124,000
Interest Rate
4.77%
Mortgage Type
New Conventional
Purchase Details
Closed on
Mar 29, 2002
Sold by
Calhoun Tommy B and Calhoun Molly R
Bought by
Bolyard Randall D and Hughes Shellie L
Purchase Details
Closed on
Oct 26, 1993
Bought by
Calhoun Tommy B and Calhoun Molly R
Purchase Details
Closed on
Dec 10, 1992
Create a Home Valuation Report for This Property
The Home Valuation Report is an in-depth analysis detailing your home's value as well as a comparison with similar homes in the area
Home Values in the Area
Average Home Value in this Area
Purchase History
| Date | Buyer | Sale Price | Title Company |
|---|---|---|---|
| Hughes Ronald G | $190,000 | Attorney | |
| Bolyard Randall D | $200,000 | Chicago Title | |
| Calhoun Tommy B | $144,000 | -- | |
| -- | -- | -- |
Source: Public Records
Mortgage History
| Date | Status | Borrower | Loan Amount |
|---|---|---|---|
| Previous Owner | Hughes Ronald G | $124,000 |
Source: Public Records
Tax History Compared to Growth
Tax History
| Year | Tax Paid | Tax Assessment Tax Assessment Total Assessment is a certain percentage of the fair market value that is determined by local assessors to be the total taxable value of land and additions on the property. | Land | Improvement |
|---|---|---|---|---|
| 2024 | $4,219 | $125,520 | $40,150 | $85,370 |
| 2023 | $4,167 | $125,510 | $40,145 | $85,365 |
| 2022 | $4,320 | $97,270 | $14,810 | $82,460 |
| 2021 | $4,407 | $97,270 | $14,810 | $82,460 |
| 2020 | $4,382 | $97,270 | $14,810 | $82,460 |
| 2019 | $3,945 | $79,070 | $11,830 | $67,240 |
| 2018 | $3,617 | $79,070 | $11,830 | $67,240 |
| 2017 | $3,909 | $79,070 | $11,830 | $67,240 |
| 2016 | $3,308 | $63,430 | $12,080 | $51,350 |
| 2015 | $3,308 | $63,430 | $12,080 | $51,350 |
| 2014 | $3,311 | $63,430 | $12,080 | $51,350 |
| 2013 | $1,870 | $62,265 | $12,075 | $50,190 |
Source: Public Records
Map
Nearby Homes
- 3495 La Coste Ln
- 3664 Grimes Dr
- 3757 Gibbstone Dr
- 3761 Gibbstone Dr
- 4000 Sandy Ridge Dr
- 3254 Dover Rd
- 3570 Dover Rd
- 3252 Dover Rd
- 2051 Tuckaway Ct
- 3161 Bowdoin Cir
- 1150 Romona Place
- 0 Lowell Dr Unit 223009270
- 2754 Scioto Station Dr
- 2704 Scioto Station Dr Unit 2704
- 2350 Hetter St
- 2867 Kobuk Dr Unit 404
- 2867 Kobuk Dr Unit 304
- 2867 Kobuk Dr Unit 402
- 2867 Kobuk Dr Unit 201
- 2875 Lowell Dr
- 1556 Whitcombe Way
- 1572 Whitcombe Way
- 1580 Whitcombe Way
- 1567 Weiskopf Dr
- 1548 Whitcombe Way
- 1559 Weiskopf Dr
- 1588 Whitcombe Way
- 1551 Weiskopf Dr
- 1545 Whitcombe Way
- 1569 Whitcombe Way
- 1540 Whitcombe Way
- 1537 Weiskopf Dr
- 1563 Whitcombe Way
- 1575 Whitcombe Way
- 3680 Newell Dr
- 1581 Whitcombe Way
- 3660 Newell Dr
- 1587 Whitcombe Way
- 1549 Tillinghast Dr
- 1568 Weiskopf Dr