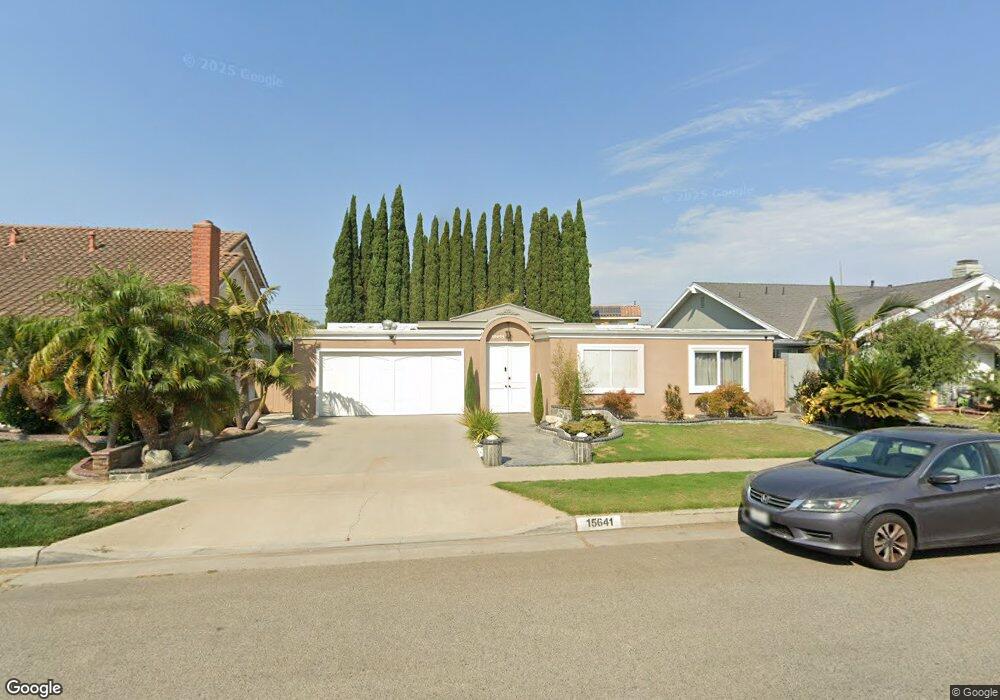
15641 Pensacola St Westminster, CA 92683
Star View NeighborhoodEstimated Value: $1,179,284 - $1,310,000
4
Beds
3
Baths
1,932
Sq Ft
$643/Sq Ft
Est. Value
About This Home
This home is located at 15641 Pensacola St, Westminster, CA 92683 and is currently estimated at $1,242,071, approximately $642 per square foot. 15641 Pensacola St is a home located in Orange County with nearby schools including Star View Elementary, Vista View Middle School, and Ocean View High.
Ownership History
Date
Name
Owned For
Owner Type
Purchase Details
Closed on
Jun 24, 2016
Sold by
Vannguyen Bau
Bought by
Vannguyen Bau and The Bau Nguyen Trust
Current Estimated Value
Purchase Details
Closed on
Sep 24, 2012
Sold by
Pensacola Trust #15641
Bought by
Vannguyen Bau
Home Financials for this Owner
Home Financials are based on the most recent Mortgage that was taken out on this home.
Original Mortgage
$415,200
Outstanding Balance
$288,594
Interest Rate
3.59%
Mortgage Type
New Conventional
Estimated Equity
$953,477
Purchase Details
Closed on
Jun 13, 2012
Sold by
Riola Toby and Riola Wendy
Bought by
Pensacola Trust #15641 and Southland Homes Real Estate & Investment
Purchase Details
Closed on
Oct 27, 1999
Sold by
Arthur Riola and Arthur Jennie N
Bought by
Riola Toby and Riola Wendy
Home Financials for this Owner
Home Financials are based on the most recent Mortgage that was taken out on this home.
Original Mortgage
$208,283
Interest Rate
7.95%
Mortgage Type
FHA
Create a Home Valuation Report for This Property
The Home Valuation Report is an in-depth analysis detailing your home's value as well as a comparison with similar homes in the area
Home Values in the Area
Average Home Value in this Area
Purchase History
| Date | Buyer | Sale Price | Title Company |
|---|---|---|---|
| Vannguyen Bau | -- | None Available | |
| Vannguyen Bau | $519,000 | First American Title Company | |
| Pensacola Trust #15641 | -- | None Available | |
| Riola Toby | $210,000 | Commonwealth Land Title |
Source: Public Records
Mortgage History
| Date | Status | Borrower | Loan Amount |
|---|---|---|---|
| Open | Vannguyen Bau | $415,200 | |
| Previous Owner | Riola Toby | $208,283 |
Source: Public Records
Tax History Compared to Growth
Tax History
| Year | Tax Paid | Tax Assessment Tax Assessment Total Assessment is a certain percentage of the fair market value that is determined by local assessors to be the total taxable value of land and additions on the property. | Land | Improvement |
|---|---|---|---|---|
| 2025 | $7,389 | $639,104 | $496,958 | $142,146 |
| 2024 | $7,389 | $626,573 | $487,214 | $139,359 |
| 2023 | $7,218 | $614,288 | $477,661 | $136,627 |
| 2022 | $7,108 | $602,244 | $468,295 | $133,949 |
| 2021 | $6,958 | $590,436 | $459,113 | $131,323 |
| 2020 | $6,883 | $584,382 | $454,405 | $129,977 |
| 2019 | $6,767 | $572,924 | $445,495 | $127,429 |
| 2018 | $6,620 | $561,691 | $436,760 | $124,931 |
| 2017 | $6,518 | $550,678 | $428,196 | $122,482 |
| 2016 | $6,259 | $539,881 | $419,800 | $120,081 |
| 2015 | $6,167 | $531,772 | $413,494 | $118,278 |
| 2014 | $6,050 | $521,356 | $405,394 | $115,962 |
Source: Public Records
Map
Nearby Homes
- 8822 Palos Verdes Ave
- 8961 Emerald Ave
- 8331 Gumwood Cir
- 15300 Magnolia St Unit 71
- 8206 Maureen Dr Unit 16
- 9190 Poppy Cir
- 8200 Bosa Ave Unit 92
- 8200 Bolsa Ave Unit 2
- 8200 Bolsa Ave Unit 42
- 16102 Malaga Ln
- 8200 Bolsa Ave Spc#146
- 15081 Van Buren St
- 15110 Henley Dr Unit 51
- 15621 Beach Blvd Unit 74
- 15621 Beach Blvd Unit 108
- 15621 Beach Blvd Unit 28
- 15621 Beach Blvd
- 15621 Beach Blvd Unit 115
- 15621 Beach Blvd Unit 23
- 15621 Beach Blvd Unit 19
- 15631 Pensacola St
- 15651 Pensacola St
- 8592 Fairmont Cir
- 15621 Pensacola St
- 15671 Pensacola St
- 8582 Fairmont Cir
- 15662 Skylinks Cir
- 8642 Del Ray Cir
- 15672 Skylinks Cir
- 8591 Fairmont Cir
- 15611 Pensacola St
- 8641 Saint Andrews Ave
- 15681 Pensacola St
- 8652 Del Ray Cir
- 8641 Del Ray Cir
- 8581 Fairmont Cir
- 15661 Skylinks Cir
- 15682 Skylinks Cir
- 15601 Pensacola St
- 8651 Saint Andrews Ave