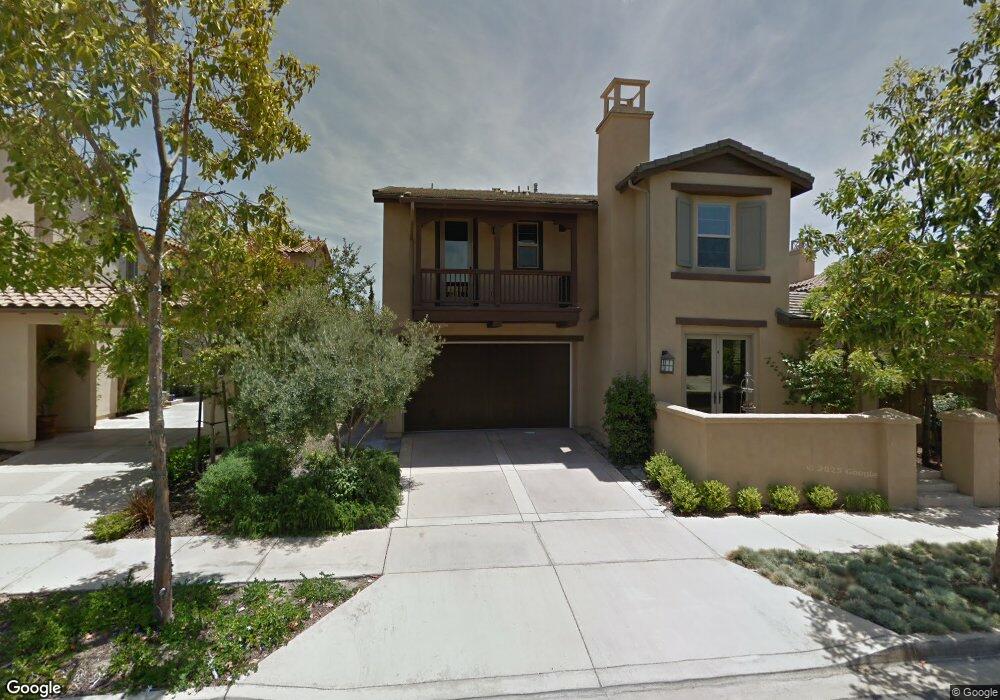
15657 Via Montecristo San Diego, CA 92127
Del Sur NeighborhoodEstimated Value: $1,761,463 - $2,092,000
4
Beds
3
Baths
2,460
Sq Ft
$762/Sq Ft
Est. Value
About This Home
This home is located at 15657 Via Montecristo, San Diego, CA 92127 and is currently estimated at $1,874,616, approximately $762 per square foot. 15657 Via Montecristo is a home located in San Diego County with nearby schools including Del Sur Elementary School, Oak Valley Middle, and Del Norte High School.
Ownership History
Date
Name
Owned For
Owner Type
Purchase Details
Closed on
May 20, 2021
Sold by
Leychkis David and Leychkis Olga
Bought by
Leychkis David and Leychkis Olga
Current Estimated Value
Purchase Details
Closed on
Dec 1, 2011
Sold by
Lam Kimberly
Bought by
Chittaphong Lam
Purchase Details
Closed on
Nov 18, 2011
Sold by
Chittaphong Lam
Bought by
Leychkis David and Leychkis Olga
Purchase Details
Closed on
Oct 19, 2006
Sold by
William Lyon Homes Inc
Bought by
Chittaphong Lam
Home Financials for this Owner
Home Financials are based on the most recent Mortgage that was taken out on this home.
Original Mortgage
$634,450
Interest Rate
6.38%
Mortgage Type
Unknown
Create a Home Valuation Report for This Property
The Home Valuation Report is an in-depth analysis detailing your home's value as well as a comparison with similar homes in the area
Home Values in the Area
Average Home Value in this Area
Purchase History
| Date | Buyer | Sale Price | Title Company |
|---|---|---|---|
| Leychkis David | -- | None Available | |
| Chittaphong Lam | -- | Equity Title | |
| Leychkis David | $560,000 | Equity Title | |
| Chittaphong Lam | $793,500 | Chicago Title Co |
Source: Public Records
Mortgage History
| Date | Status | Borrower | Loan Amount |
|---|---|---|---|
| Previous Owner | Chittaphong Lam | $634,450 |
Source: Public Records
Tax History Compared to Growth
Tax History
| Year | Tax Paid | Tax Assessment Tax Assessment Total Assessment is a certain percentage of the fair market value that is determined by local assessors to be the total taxable value of land and additions on the property. | Land | Improvement |
|---|---|---|---|---|
| 2025 | $15,144 | $703,379 | $295,167 | $408,212 |
| 2024 | $15,144 | $689,588 | $289,380 | $400,208 |
| 2023 | $14,806 | $676,067 | $283,706 | $392,361 |
| 2022 | $14,521 | $662,812 | $278,144 | $384,668 |
| 2021 | $14,245 | $649,817 | $272,691 | $377,126 |
| 2020 | $14,000 | $643,155 | $269,895 | $373,260 |
| 2019 | $13,685 | $630,545 | $264,603 | $365,942 |
| 2018 | $13,361 | $618,182 | $259,415 | $358,767 |
| 2017 | $81 | $606,062 | $254,329 | $351,733 |
| 2016 | $12,833 | $594,180 | $249,343 | $344,837 |
| 2015 | $12,683 | $585,256 | $245,598 | $339,658 |
| 2014 | $12,409 | $573,793 | $240,788 | $333,005 |
Source: Public Records
Map
Nearby Homes
- 15701 Concord Ridge Terrace
- 16055 Penny Ln
- 15530 New Park Terrace
- 15583 Rising River Place S
- 15809 Concord Ridge Terrace
- 15609 Hayden Lake Place
- 8458 Christopher Ridge Terrace
- 8451 Hidden Cove Way
- 16231 Sunny Summit Dr
- 8492 Blackburn Ln
- 0 Artesian Trail S Unit SDC0001140
- 15763 Kristen Glen
- 8528 Old Stonefield Chase
- 16733 Calle Hermosa
- 7910 Nathaniel Ct
- 8318 The Landing Way
- 7561 Artesian Rd
- 8282 Top O the Morning Way
- 16622 Sweet Leilani Ln
- 8308 Top O the Morning Way
- 15661 Via Montecristo
- 8415 Parkside Crescent
- 8409 Parkside Crescent
- 15658 New Park Terrace
- 15665 Via Montecristo
- 15662 New Park Terrace
- 8403 Parkside Crescent
- 15666 New Park Terrace
- 15658 Via Montecristo
- 15669 Via Montecristo
- 15654 Via Montecristo
- 15662 Via Montecristo
- 15670 New Park Terrace
- 15650 Via Montecristo
- 15666 Via Montecristo
- 15645 Via Montecristo
- 15673 Via Montecristo
- 8492 Kern Crescent
- 15646 New Park Terrace
- 15670 Via Montecristo