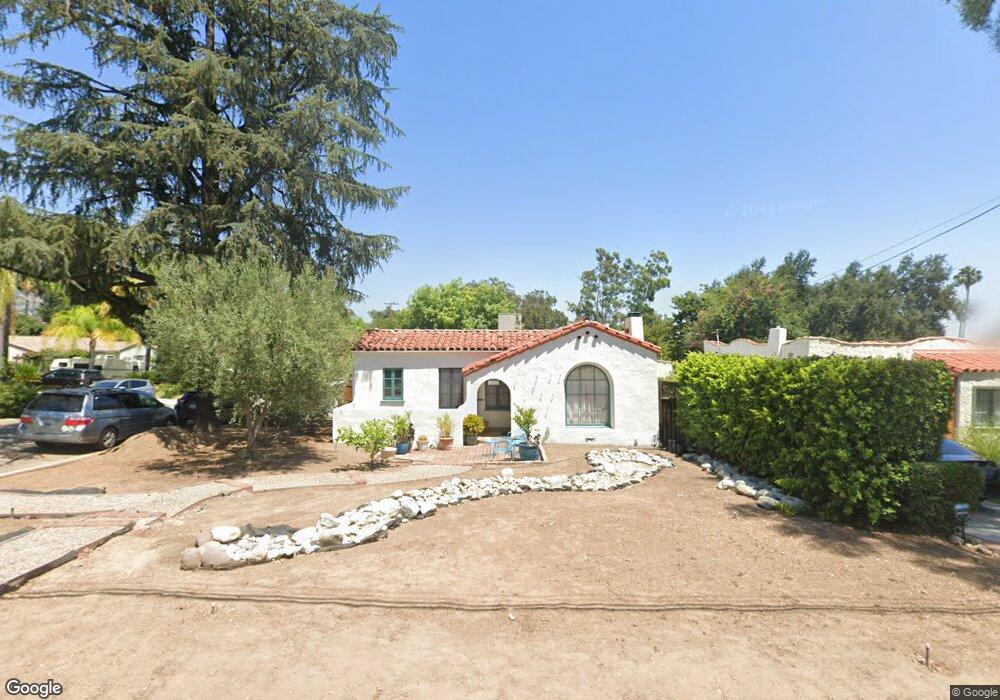
1566 Pepper Dr Pasadena, CA 91104
Estimated Value: $1,204,000 - $1,455,000
3
Beds
3
Baths
1,765
Sq Ft
$782/Sq Ft
Est. Value
About This Home
This home is located at 1566 Pepper Dr, Pasadena, CA 91104 and is currently estimated at $1,380,460, approximately $782 per square foot. 1566 Pepper Dr is a home located in Los Angeles County with nearby schools including Webster Elementary School, Charles W. Eliot Arts Magnet Academy, and Pasadena High School.
Ownership History
Date
Name
Owned For
Owner Type
Purchase Details
Closed on
Jul 9, 2025
Sold by
Kiesel Roger Alan and Kiesel Wanejune
Bought by
Kiesel Family Trust and Kiesel
Current Estimated Value
Purchase Details
Closed on
Jul 3, 2002
Sold by
Sailor Lee W and Sailor Lisa H
Bought by
Kiesel Roger A
Home Financials for this Owner
Home Financials are based on the most recent Mortgage that was taken out on this home.
Original Mortgage
$300,700
Interest Rate
6.71%
Purchase Details
Closed on
Jun 12, 1995
Sold by
Spring Jeffrey A and Spring Joanne E
Bought by
Sailor Lee W
Home Financials for this Owner
Home Financials are based on the most recent Mortgage that was taken out on this home.
Original Mortgage
$176,200
Interest Rate
7.62%
Create a Home Valuation Report for This Property
The Home Valuation Report is an in-depth analysis detailing your home's value as well as a comparison with similar homes in the area
Home Values in the Area
Average Home Value in this Area
Purchase History
| Date | Buyer | Sale Price | Title Company |
|---|---|---|---|
| Kiesel Family Trust | -- | None Listed On Document | |
| Kiesel Roger A | $395,000 | Equity Title Company | |
| Sailor Lee W | $185,500 | Chicago Title Insurance Co |
Source: Public Records
Mortgage History
| Date | Status | Borrower | Loan Amount |
|---|---|---|---|
| Previous Owner | Kiesel Roger A | $300,700 | |
| Previous Owner | Sailor Lee W | $176,200 | |
| Closed | Kiesel Roger A | $54,405 |
Source: Public Records
Tax History
| Year | Tax Paid | Tax Assessment Tax Assessment Total Assessment is a certain percentage of the fair market value that is determined by local assessors to be the total taxable value of land and additions on the property. | Land | Improvement |
|---|---|---|---|---|
| 2025 | $7,571 | $644,976 | $457,663 | $187,313 |
| 2024 | $7,571 | $632,331 | $448,690 | $183,641 |
| 2023 | $7,502 | $619,934 | $439,893 | $180,041 |
| 2022 | $7,245 | $607,779 | $431,268 | $176,511 |
| 2021 | $6,865 | $595,862 | $422,812 | $173,050 |
| 2019 | $6,609 | $578,190 | $410,272 | $167,918 |
| 2018 | $6,692 | $566,854 | $402,228 | $164,626 |
| 2016 | $6,480 | $544,845 | $386,610 | $158,235 |
| 2015 | $6,409 | $536,662 | $380,803 | $155,859 |
| 2014 | $6,279 | $526,150 | $373,344 | $152,806 |
Source: Public Records
Map
Nearby Homes
- 2235 Garfias Dr
- 1685 Roosevelt Ave
- 1716 N Roosevelt Ave
- 1511 Coolidge Ave
- 1932 E Washington Blvd
- 1667 N Allen Ave
- 1430 N Dominion Ave
- 1730 Veranada Ave
- 1818 New York Dr
- 2209 Queensberry Rd
- 1670 N Oxford Ave
- 1848 N Altadena Dr
- 1786 Asbury Dr
- 1809 Sonoma Dr
- 1274 N Sierra Bonita Ave
- 1670 Asbury Dr
- 1807 Vistillas Rd
- 1453 Bresee Ave
- 2065 Canyon Close Rd
- 1158 Bella Vista Ave
- 1558 Pepper Dr
- 1550 Pepper Dr
- 2142 E Crary St
- 2125 E Crary St
- 2125 E Crary St
- 1542 Pepper Dr
- 2133 E Crary St
- 2119 E Crary St
- 2148 E Crary St
- 2141 E Crary St
- 2158 E Crary St
- 1571 Pepper Dr
- 1563 Pepper Dr
- 1579 Pepper Dr
- 2129 Layton St
- 2149 E Crary St
- 1557 Pepper Dr
- 2141 Layton St
- 2121 Layton St
- 2096 E Crary St
Your Personal Tour Guide
Ask me questions while you tour the home.