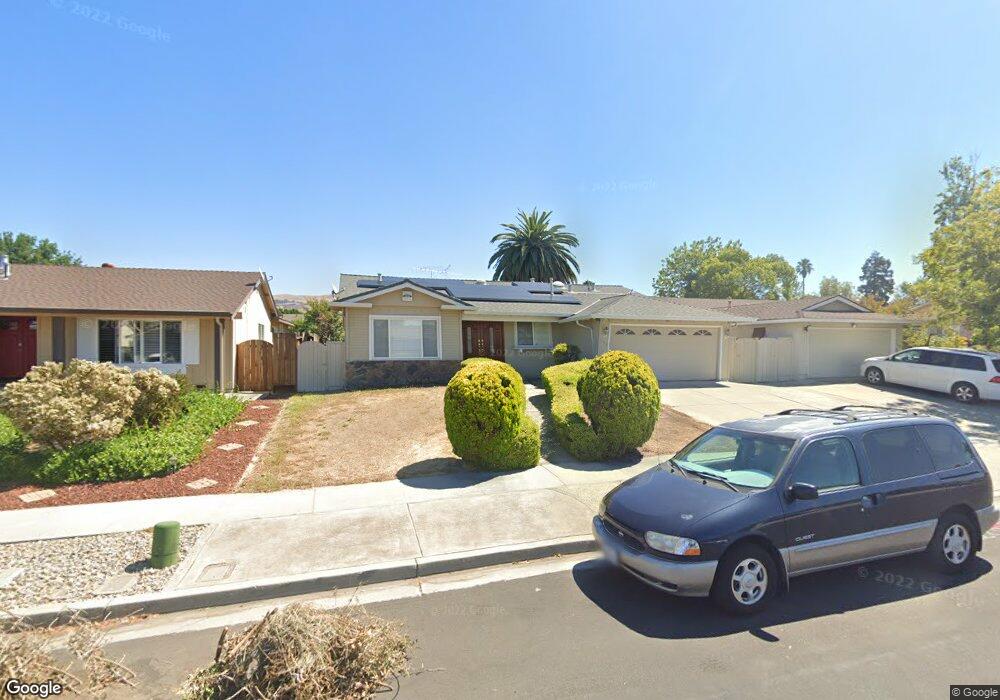
1566 Stubbins Way San Jose, CA 95132
Ruskin NeighborhoodEstimated Value: $1,750,304 - $1,990,000
4
Beds
2
Baths
1,806
Sq Ft
$1,026/Sq Ft
Est. Value
About This Home
This home is located at 1566 Stubbins Way, San Jose, CA 95132 and is currently estimated at $1,853,826, approximately $1,026 per square foot. 1566 Stubbins Way is a home located in Santa Clara County with nearby schools including Ruskin Elementary School, Sierramont Middle School, and Piedmont Hills High School.
Ownership History
Date
Name
Owned For
Owner Type
Purchase Details
Closed on
Mar 26, 2009
Sold by
Mach Quang and Mach Kenny Trien
Bought by
Mach Kenny Trien and Mach Xiuqiao Hu
Current Estimated Value
Purchase Details
Closed on
Feb 15, 2006
Sold by
Mach Quang
Bought by
Mach Quang and Mach Kenny Trien
Purchase Details
Closed on
Nov 10, 2004
Sold by
Mach Nancy and Mach Quang
Bought by
Mach Quang and Mach Nancy
Home Financials for this Owner
Home Financials are based on the most recent Mortgage that was taken out on this home.
Original Mortgage
$492,000
Interest Rate
5.79%
Mortgage Type
New Conventional
Purchase Details
Closed on
Aug 6, 1998
Sold by
Johnson Fooshee Marjorie J and Johnson Edward
Bought by
Mach Quang Huu and Diep Nu
Home Financials for this Owner
Home Financials are based on the most recent Mortgage that was taken out on this home.
Original Mortgage
$272,000
Interest Rate
6.95%
Purchase Details
Closed on
Oct 25, 1995
Sold by
Johnson Fooshee Marjorie J and Johnson Marjorie J
Bought by
Johnson Fooshee Marjorie J and Johnson Edward
Create a Home Valuation Report for This Property
The Home Valuation Report is an in-depth analysis detailing your home's value as well as a comparison with similar homes in the area
Home Values in the Area
Average Home Value in this Area
Purchase History
| Date | Buyer | Sale Price | Title Company |
|---|---|---|---|
| Mach Kenny Trien | -- | None Available | |
| Mach Quang | -- | None Available | |
| Mach Quang | -- | Chicago Title | |
| Mach Quang Huu | $340,000 | Financial Title Company | |
| Johnson Fooshee Marjorie J | -- | North American Title Co |
Source: Public Records
Mortgage History
| Date | Status | Borrower | Loan Amount |
|---|---|---|---|
| Previous Owner | Mach Quang | $492,000 | |
| Previous Owner | Mach Quang Huu | $272,000 | |
| Closed | Mach Quang Huu | $34,000 |
Source: Public Records
Tax History Compared to Growth
Tax History
| Year | Tax Paid | Tax Assessment Tax Assessment Total Assessment is a certain percentage of the fair market value that is determined by local assessors to be the total taxable value of land and additions on the property. | Land | Improvement |
|---|---|---|---|---|
| 2025 | $8,148 | $533,002 | $213,199 | $319,803 |
| 2024 | $8,148 | $522,552 | $209,019 | $313,533 |
| 2023 | $7,989 | $512,307 | $204,921 | $307,386 |
| 2022 | $7,953 | $502,262 | $200,903 | $301,359 |
| 2021 | $7,683 | $492,414 | $196,964 | $295,450 |
| 2020 | $7,436 | $487,366 | $194,945 | $292,421 |
| 2019 | $7,152 | $477,811 | $191,123 | $286,688 |
| 2018 | $7,046 | $468,443 | $187,376 | $281,067 |
| 2017 | $7,079 | $459,258 | $183,702 | $275,556 |
| 2016 | $6,784 | $450,253 | $180,100 | $270,153 |
| 2015 | $6,702 | $443,491 | $177,395 | $266,096 |
| 2014 | $6,074 | $434,805 | $173,921 | $260,884 |
Source: Public Records
Map
Nearby Homes
- 2966 Crater Ln
- 1373 Ferrel Ct
- 1756 Valhalla Ct
- 2790 Longford Dr
- 3093 Melchester Dr
- 3070 Ironside Ct
- 1810 Blackmore Ct
- 2616 Sierra Village Ct
- 3190 Vesuvius Ln
- 1693 Peachwood Dr
- 2844 Parkrow Ln
- 1545 Stone Creek Dr
- 1199 Morrill Ave
- 3211 Parkhaven Dr
- 3252 Cropley Ave
- 3248 Woody Ln
- 3092 Halgrim Ct
- 2520 Amaryl Dr
- 2280 Zoria Cir
- 3108 Kermath Dr
- 1562 Stubbins Way
- 1572 Stubbins Way
- 1555 Turriff Way
- 1556 Stubbins Way
- 1549 Turriff Way
- 1578 Stubbins Way
- 1563 Turriff Way
- 1541 Turriff Way
- 1569 Turriff Way
- 1567 Stubbins Way
- 1563 Stubbins Way
- 1573 Stubbins Way
- 1552 Stubbins Way
- 1584 Stubbins Way
- 1557 Stubbins Way
- 1535 Turriff Way
- 1577 Stubbins Way
- 1553 Stubbins Way
- 1546 Stubbins Way
- 1588 Stubbins Way