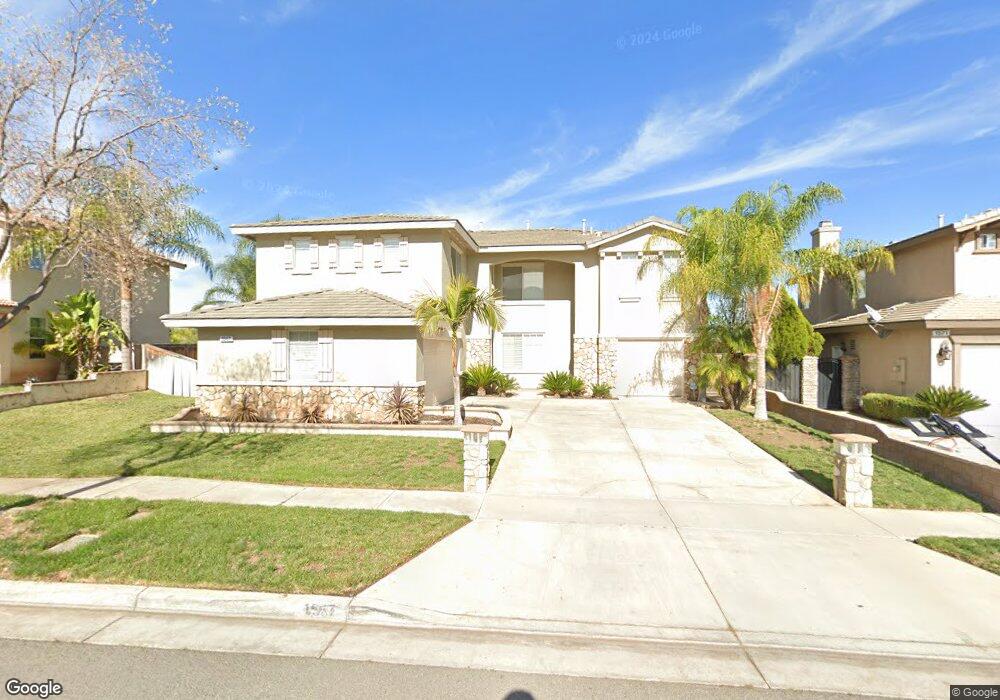
1567 Carleton Ct Corona, CA 92881
South Corona NeighborhoodEstimated Value: $884,368 - $1,053,000
5
Beds
3
Baths
2,884
Sq Ft
$334/Sq Ft
Est. Value
About This Home
This home is located at 1567 Carleton Ct, Corona, CA 92881 and is currently estimated at $963,342, approximately $334 per square foot. 1567 Carleton Ct is a home located in Riverside County with nearby schools including Orange Elementary School, Citrus Hills Intermediate School, and Santiago High School.
Ownership History
Date
Name
Owned For
Owner Type
Purchase Details
Closed on
Aug 5, 2022
Sold by
Krista Suddeth-Ford
Bought by
Ford Darnell
Current Estimated Value
Home Financials for this Owner
Home Financials are based on the most recent Mortgage that was taken out on this home.
Original Mortgage
$60,000
Outstanding Balance
$55,788
Interest Rate
3%
Estimated Equity
$907,554
Purchase Details
Closed on
Jul 16, 2013
Sold by
Ford Krista K
Bought by
Mercury Financial Group
Purchase Details
Closed on
Oct 27, 2008
Sold by
Ford Darnell G and Ford Krista K
Bought by
Ford Krista K
Purchase Details
Closed on
Aug 1, 2007
Sold by
Ford Darnell G and Ford Krista K
Bought by
Ford Darnell G and Ford Krista K
Purchase Details
Closed on
May 7, 2001
Sold by
Crc Associates Lp
Bought by
Ford Darnell G and Ford Krista K
Home Financials for this Owner
Home Financials are based on the most recent Mortgage that was taken out on this home.
Original Mortgage
$236,200
Interest Rate
7.15%
Create a Home Valuation Report for This Property
The Home Valuation Report is an in-depth analysis detailing your home's value as well as a comparison with similar homes in the area
Home Values in the Area
Average Home Value in this Area
Purchase History
| Date | Buyer | Sale Price | Title Company |
|---|---|---|---|
| Ford Darnell | -- | -- | |
| Ford Darnell | -- | None Listed On Document | |
| Mercury Financial Group | -- | Stewart Title Of Ca Rv | |
| Ford Krista K | -- | Ntc | |
| Ford Darnell G | -- | None Available | |
| Ford Darnell G | $295,500 | -- |
Source: Public Records
Mortgage History
| Date | Status | Borrower | Loan Amount |
|---|---|---|---|
| Open | Ford Darnell | $60,000 | |
| Closed | Ford Darnell | $60,000 | |
| Open | Ford Darnell | $528,500 | |
| Closed | Ford Darnell | $528,500 | |
| Previous Owner | Ford Darnell G | $236,200 | |
| Closed | Ford Darnell G | $29,530 |
Source: Public Records
Tax History
| Year | Tax Paid | Tax Assessment Tax Assessment Total Assessment is a certain percentage of the fair market value that is determined by local assessors to be the total taxable value of land and additions on the property. | Land | Improvement |
|---|---|---|---|---|
| 2025 | $4,923 | $435,776 | $118,171 | $317,605 |
| 2023 | $4,923 | $418,856 | $113,583 | $305,273 |
| 2022 | $4,764 | $410,644 | $111,356 | $299,288 |
| 2021 | $4,672 | $402,593 | $109,173 | $293,420 |
| 2020 | $4,622 | $398,466 | $108,054 | $290,412 |
| 2019 | $4,519 | $390,654 | $105,936 | $284,718 |
| 2018 | $5,065 | $382,995 | $103,859 | $279,136 |
| 2017 | $5,155 | $375,486 | $101,823 | $273,663 |
| 2016 | $5,145 | $368,125 | $99,827 | $268,298 |
| 2015 | $5,064 | $362,598 | $98,329 | $264,269 |
| 2014 | $4,941 | $355,497 | $96,403 | $259,094 |
Source: Public Records
Map
Nearby Homes
- 3228 Willow Park Dr
- 2785 State St
- 3260 Howe St
- 1610 Via Roma Cir
- 7230 Sarsaparilla Dr
- 7110 Saw Mill Rd
- 20070 Winton Rd
- 1351 Longwood Pines Ln
- 2899 Menorca Cir
- 1456 Roadrunner Dr
- 1414 Baldwin Dr
- 1284 Longport Way
- 1236 Kendrick Ct
- 3704 Howe St
- 20065 Case St
- 1411 Sallie Jeffreys Way
- 1345 Sallie Jeffreys Way
- 2416 Notre Dame Way
- 2515 Sweet Rain Way
- 2487 Sweet Rain Way
- 1563 Carleton Ct
- 1571 Carleton Ct
- 1570 Lupine Cir
- 1574 Lupine Cir
- 1566 Lupine Cir
- 1559 Carleton Ct
- 1575 Carleton Ct
- 1582 Lupine Cir
- 1562 Carleton Ct
- 1562 Lupine Cir
- 1558 Carleton Ct
- 1588 Lupine Cir
- 1566 Carleton Ct
- 1555 Carleton Ct
- 0 Tamarisk Kn Unit DW18002508
- 3233 Tamarisk Ln
- 1554 Carleton Ct
- 1558 Lupine Cir
- 1554 Lupine Cir
- 1583 Via Aurora Cir
Your Personal Tour Guide
Ask me questions while you tour the home.