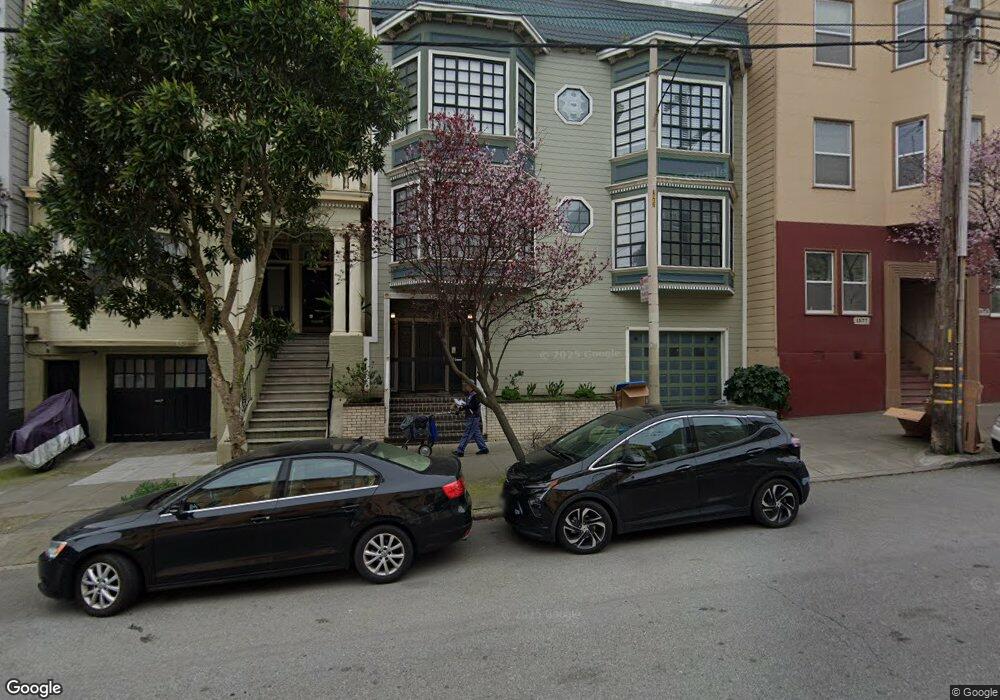
1567 Mcallister St Unit 201 San Francisco, CA 94115
Alamo Square NeighborhoodEstimated Value: $1,248,000 - $1,360,000
2
Beds
2
Baths
1,121
Sq Ft
$1,159/Sq Ft
Est. Value
About This Home
This home is located at 1567 Mcallister St Unit 201, San Francisco, CA 94115 and is currently estimated at $1,299,299, approximately $1,159 per square foot. 1567 Mcallister St Unit 201 is a home located in San Francisco County with nearby schools including Muir (John) Elementary School, James Lick Middle School, and Creative Arts Charter School.
Ownership History
Date
Name
Owned For
Owner Type
Purchase Details
Closed on
Jun 22, 2015
Sold by
Ma Mahau
Bought by
Mei Hao Yun
Current Estimated Value
Purchase Details
Closed on
Sep 16, 2005
Sold by
Stehling Stephanie A and Zemo Dawn A
Bought by
Ma Mahau
Home Financials for this Owner
Home Financials are based on the most recent Mortgage that was taken out on this home.
Original Mortgage
$66,500
Interest Rate
5.33%
Mortgage Type
Credit Line Revolving
Purchase Details
Closed on
Jun 10, 2002
Sold by
Stehling Stephanie A and Zemo Dawn A
Bought by
Stehling Stephanie A and Zemo Dawn A
Purchase Details
Closed on
Oct 17, 2001
Sold by
Stehling Stephanie A and Zemo Dawn A
Bought by
Stehling Stephanie A and Zemo Dawn A
Purchase Details
Closed on
Jun 19, 1998
Sold by
Zemo Dawn A
Bought by
Stehling Stephanie A and Zemo Dawn A
Create a Home Valuation Report for This Property
The Home Valuation Report is an in-depth analysis detailing your home's value as well as a comparison with similar homes in the area
Home Values in the Area
Average Home Value in this Area
Purchase History
| Date | Buyer | Sale Price | Title Company |
|---|---|---|---|
| Mei Hao Yun | $1,250,000 | Old Republic Title Company | |
| Ma Mahau | $665,000 | Chicago Title Co | |
| Stehling Stephanie A | -- | -- | |
| Stehling Stephanie A | -- | -- | |
| Stehling Stephanie A | -- | -- |
Source: Public Records
Mortgage History
| Date | Status | Borrower | Loan Amount |
|---|---|---|---|
| Previous Owner | Ma Mahau | $66,500 | |
| Previous Owner | Ma Mahau | $532,000 |
Source: Public Records
Tax History Compared to Growth
Tax History
| Year | Tax Paid | Tax Assessment Tax Assessment Total Assessment is a certain percentage of the fair market value that is determined by local assessors to be the total taxable value of land and additions on the property. | Land | Improvement |
|---|---|---|---|---|
| 2025 | $18,089 | $1,502,304 | $751,152 | $751,152 |
| 2024 | $18,089 | $1,472,848 | $736,424 | $736,424 |
| 2023 | $17,783 | $1,443,970 | $721,985 | $721,985 |
| 2022 | $17,433 | $1,415,658 | $707,829 | $707,829 |
| 2021 | $17,124 | $1,387,900 | $693,950 | $693,950 |
| 2020 | $17,201 | $1,373,670 | $686,835 | $686,835 |
| 2019 | $16,612 | $1,346,736 | $673,368 | $673,368 |
| 2018 | $16,054 | $1,320,330 | $660,165 | $660,165 |
| 2017 | $15,566 | $1,294,442 | $647,221 | $647,221 |
| 2016 | $15,316 | $1,269,062 | $634,531 | $634,531 |
| 2015 | $9,286 | $756,144 | $378,072 | $378,072 |
| 2014 | -- | $741,334 | $370,667 | $370,667 |
Source: Public Records
Map
Nearby Homes
- 613 Broderick St
- 617 Broderick St Unit B
- 535 Broderick St
- 1909 Eddy St Unit 3
- 529 Broderick St Unit A
- 516 Baker St Unit 516
- 1828 Eddy St Unit 101
- 1057 Steiner St
- 988 Fulton St Unit 132
- 1048-1050 Oak St
- 726 Lyon St
- 560 Lyon St
- 350 Broderick St Unit 300
- 2000 Ellis St Unit 201
- 1365 Scott St Unit 1
- 745 Fillmore St
- 1939 Ofarrell St
- 2181 Ofarrell St
- 84 Fortuna Ave
- 841 Fulton St
- 1567 Mcallister St Unit 2
- 1567 Mcallister St Unit 202
- 1567 Mcallister St Unit 102
- 1567 Mcallister St Unit 101
- 1563 Mcallister St Unit 1563
- 1561 Mcallister St
- 1565 Mcallister St
- 1555 Mcallister St
- 846 Divisadero St
- 848 Divisadero St
- 834 Divisadero St
- 864 Divisadero St
- 1543 Mcallister St Unit 3
- 1543 Mcallister St Unit 5
- 1543 Mcallister St Unit 4
- 1543 Mcallister St Unit 2
- 1539 Mcallister St
- 820 Divisadero St Unit 824
- 830 Divisadero St
- 1266 Fulton St Unit 1270