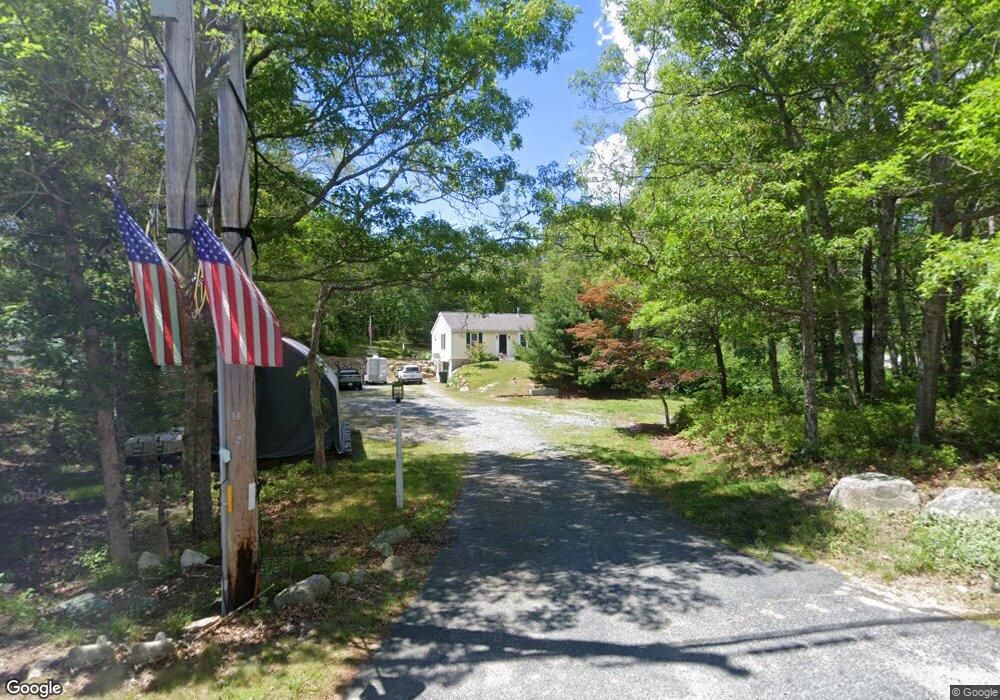
1567 Service Rd West Barnstable, MA 02668
West Barnstable NeighborhoodEstimated Value: $635,000 - $712,000
3
Beds
2
Baths
1,201
Sq Ft
$559/Sq Ft
Est. Value
About This Home
This home is located at 1567 Service Rd, West Barnstable, MA 02668 and is currently estimated at $671,818, approximately $559 per square foot. 1567 Service Rd is a home located in Barnstable County with nearby schools including Barnstable United Elementary School, West Barnstable Elementary School, and Barnstable Intermediate School.
Ownership History
Date
Name
Owned For
Owner Type
Purchase Details
Closed on
Mar 3, 2025
Sold by
Hammond Peter E and Hammond Carol A
Bought by
Hammond Ft and Hammond
Current Estimated Value
Purchase Details
Closed on
Sep 5, 1997
Sold by
Hess Walter and Hess Lenore D
Bought by
Hammond Peter E and Sandino Carol A
Purchase Details
Closed on
Jun 23, 1994
Sold by
Tiller Elaine
Bought by
Hammond Carol A
Create a Home Valuation Report for This Property
The Home Valuation Report is an in-depth analysis detailing your home's value as well as a comparison with similar homes in the area
Home Values in the Area
Average Home Value in this Area
Purchase History
| Date | Buyer | Sale Price | Title Company |
|---|---|---|---|
| Hammond Ft | -- | None Available | |
| Hammond Ft | -- | None Available | |
| Hammond Peter E | $128,500 | -- | |
| Hammond Peter E | $128,500 | -- | |
| Hammond Carol A | $165,000 | -- | |
| Hammond Carol A | $165,000 | -- |
Source: Public Records
Mortgage History
| Date | Status | Borrower | Loan Amount |
|---|---|---|---|
| Previous Owner | Hammond Carol A | $83,000 | |
| Previous Owner | Hammond Carol A | $25,000 | |
| Previous Owner | Hammond Carol A | $90,000 |
Source: Public Records
Tax History Compared to Growth
Tax History
| Year | Tax Paid | Tax Assessment Tax Assessment Total Assessment is a certain percentage of the fair market value that is determined by local assessors to be the total taxable value of land and additions on the property. | Land | Improvement |
|---|---|---|---|---|
| 2025 | $5,157 | $552,100 | $180,000 | $372,100 |
| 2024 | $4,673 | $544,600 | $180,000 | $364,600 |
| 2023 | $4,375 | $480,200 | $164,000 | $316,200 |
| 2022 | $4,454 | $400,900 | $122,500 | $278,400 |
| 2021 | $4,154 | $354,400 | $122,500 | $231,900 |
| 2020 | $4,104 | $338,600 | $130,900 | $207,700 |
| 2019 | $3,836 | $312,400 | $130,900 | $181,500 |
| 2018 | $3,587 | $289,500 | $137,700 | $151,800 |
| 2017 | $3,457 | $282,400 | $137,700 | $144,700 |
| 2016 | $3,387 | $282,500 | $137,800 | $144,700 |
| 2015 | $3,173 | $265,300 | $132,200 | $133,100 |
Source: Public Records
Map
Nearby Homes
- 40 Appaloosa Way
- 88 Joe Thompson Rd
- 74 Saddler Ln
- 50 Currycomb Cir
- 62 Three Ponds Dr
- 282 Parker Rd
- 1044 Old Falmouth Rd
- 1028 Old Falmouth Rd
- 900 Old Stage Rd
- 87 Foxglove Rd
- 66 Tern Ln
- 1825 Main St
- 296 Buckskin Path
- 315 Prince Hinckley Rd
- 29 Summerwind Ln
- 2400 Meetinghouse Way
- 81 Monomoy Cir
- 21 Shannon Way
- 205 James Otis Rd
- 55 Chickadee Ln