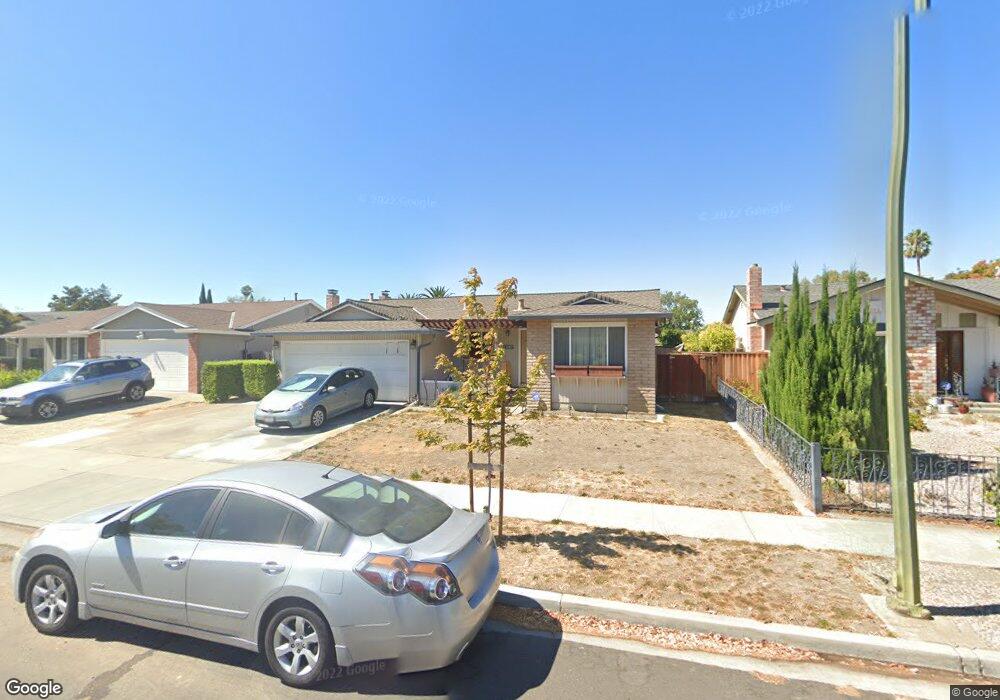
1567 Stubbins Way San Jose, CA 95132
Ruskin NeighborhoodEstimated Value: $1,639,760 - $1,863,000
4
Beds
2
Baths
1,480
Sq Ft
$1,188/Sq Ft
Est. Value
About This Home
This home is located at 1567 Stubbins Way, San Jose, CA 95132 and is currently estimated at $1,758,190, approximately $1,187 per square foot. 1567 Stubbins Way is a home located in Santa Clara County with nearby schools including Ruskin Elementary School, Sierramont Middle School, and Piedmont Hills High School.
Ownership History
Date
Name
Owned For
Owner Type
Purchase Details
Closed on
Mar 28, 2024
Sold by
Maiuolo Antonio and Maiuolo Ting-Ting
Bought by
Maiuolo Wu Family Trust and Maiuolo
Current Estimated Value
Purchase Details
Closed on
Mar 19, 2002
Sold by
Wu Ting Ting
Bought by
Maiuolo Antonio and Wu Ting Ting
Home Financials for this Owner
Home Financials are based on the most recent Mortgage that was taken out on this home.
Original Mortgage
$170,000
Interest Rate
6.85%
Purchase Details
Closed on
Mar 21, 1997
Sold by
Smith Burl R and Smith Catherine A
Bought by
Wu Ting Ting
Home Financials for this Owner
Home Financials are based on the most recent Mortgage that was taken out on this home.
Original Mortgage
$202,500
Interest Rate
7.63%
Purchase Details
Closed on
May 12, 1994
Sold by
Smith Burl R
Bought by
Smith Burl R and Smith Catherine Ann
Home Financials for this Owner
Home Financials are based on the most recent Mortgage that was taken out on this home.
Original Mortgage
$70,000
Interest Rate
8.52%
Create a Home Valuation Report for This Property
The Home Valuation Report is an in-depth analysis detailing your home's value as well as a comparison with similar homes in the area
Home Values in the Area
Average Home Value in this Area
Purchase History
| Date | Buyer | Sale Price | Title Company |
|---|---|---|---|
| Maiuolo Wu Family Trust | -- | None Listed On Document | |
| Maiuolo Antonio | -- | Fidelity National Title Co | |
| Wu Ting Ting | $270,000 | Old Republic Title Company | |
| Smith Burl R | -- | Old Republic Title Company |
Source: Public Records
Mortgage History
| Date | Status | Borrower | Loan Amount |
|---|---|---|---|
| Previous Owner | Maiuolo Antonio | $170,000 | |
| Previous Owner | Wu Ting Ting | $202,500 | |
| Previous Owner | Smith Burl R | $70,000 |
Source: Public Records
Tax History Compared to Growth
Tax History
| Year | Tax Paid | Tax Assessment Tax Assessment Total Assessment is a certain percentage of the fair market value that is determined by local assessors to be the total taxable value of land and additions on the property. | Land | Improvement |
|---|---|---|---|---|
| 2025 | $6,215 | $382,714 | $162,856 | $219,858 |
| 2024 | $6,215 | $375,211 | $159,663 | $215,548 |
| 2023 | $6,079 | $367,855 | $156,533 | $211,322 |
| 2022 | $6,045 | $360,643 | $153,464 | $207,179 |
| 2021 | $5,826 | $353,572 | $150,455 | $203,117 |
| 2020 | $5,626 | $349,948 | $148,913 | $201,035 |
| 2019 | $5,408 | $343,088 | $145,994 | $197,094 |
| 2018 | $5,320 | $336,362 | $143,132 | $193,230 |
| 2017 | $5,334 | $329,768 | $140,326 | $189,442 |
| 2016 | $5,108 | $323,303 | $137,575 | $185,728 |
| 2015 | $5,042 | $318,448 | $135,509 | $182,939 |
| 2014 | $4,477 | $312,211 | $132,855 | $179,356 |
Source: Public Records
Map
Nearby Homes
- 2790 Longford Dr
- 2966 Crater Ln
- 1373 Ferrel Ct
- 1756 Valhalla Ct
- 3093 Melchester Dr
- 1693 Peachwood Dr
- 1810 Blackmore Ct
- 2616 Sierra Village Ct
- 1199 Morrill Ave
- 3070 Ironside Ct
- 3190 Vesuvius Ln
- 2844 Parkrow Ln
- 2280 Zoria Cir
- 2520 Amaryl Dr
- 2210 Renfrew Ct
- 1545 Stone Creek Dr
- 3211 Parkhaven Dr
- 3252 Cropley Ave
- 3092 Halgrim Ct
- 2314 Oak Flat Rd
- 1573 Stubbins Way
- 1563 Stubbins Way
- 1577 Stubbins Way
- 1557 Stubbins Way
- 1462 Morrill Ave
- 1468 Morrill Ave
- 1566 Stubbins Way
- 1583 Stubbins Way
- 1553 Stubbins Way
- 1572 Stubbins Way
- 1458 Morrill Ave
- 1562 Stubbins Way
- 1472 Morrill Ave
- 1578 Stubbins Way
- 1556 Stubbins Way
- 1450 Morrill Ave
- 1478 Morrill Ave
- 1547 Stubbins Way
- 1587 Stubbins Way
- 1584 Stubbins Way