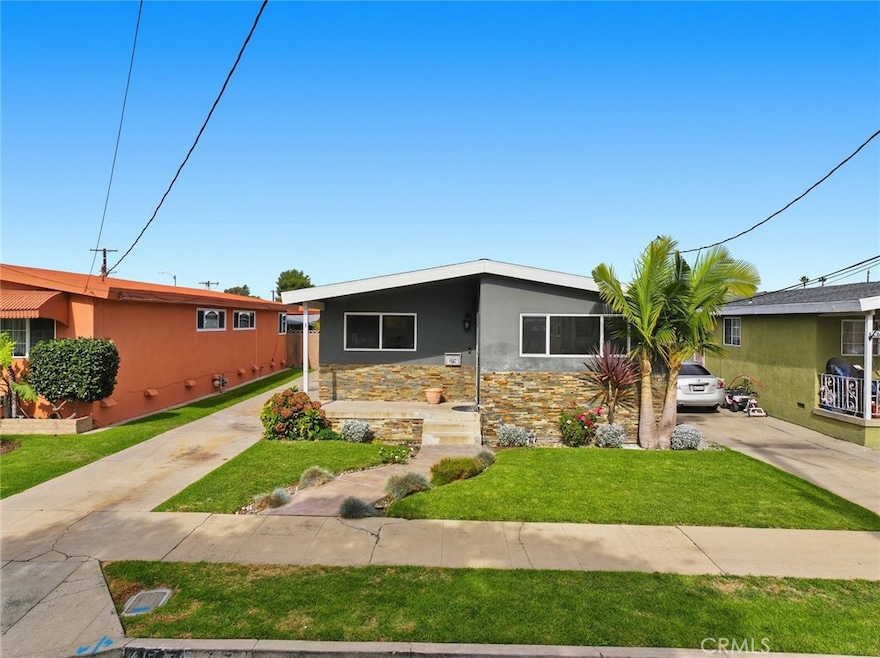
1567 W 213th St Torrance, CA 90501
Harbor Gateway NeighborhoodEstimated payment $5,059/month
Highlights
- Bluff View
- Laundry Room
- Forced Air Heating System
- No HOA
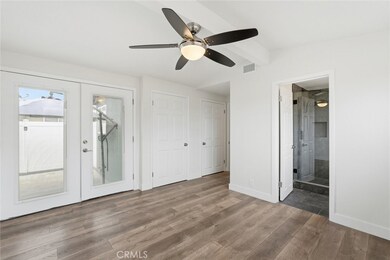
- French Doors
- 1-Story Property
About This Home
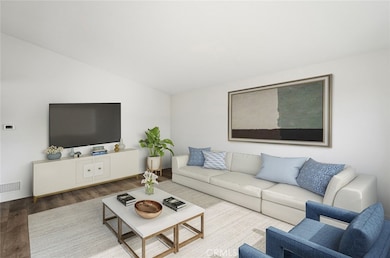
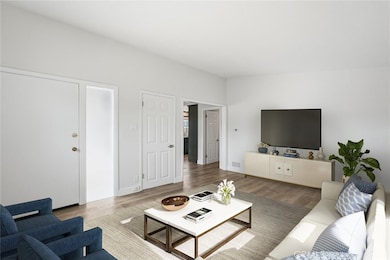
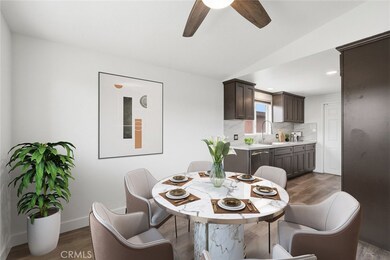
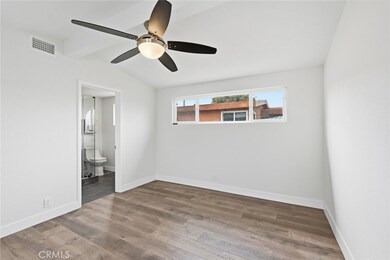
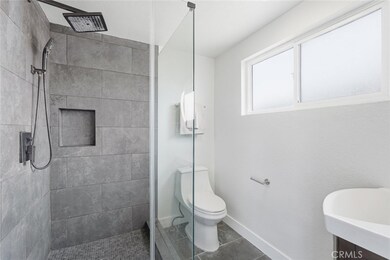
Located in a welcoming neighborhood, this warm and inviting 4-bedroom, 2-bath home beautifully blends comfort, style, and thoughtful upgrades. The updated kitchen features modern and stainless steel appliances. Throughout the living areas, brand-new hardwood style floors create an elegant flow that makes every space feel connected and effortlessly comfortable. Each of the four large bedrooms is filled with natural light, inverted ceilings. The primary suite features three large closets and a tastefully remodeled en suite bathroom that has a true spa-like feel. Outside, a large private backyard becomes your personal retreat—perfect for celebrations, weekend barbecues, or quiet moments in the sunshine. It’s an outdoor space made for connection and memories. Just minutes from the 405/110 Freeways and charming Old Town Torrance, you’ll be moments away from boutique shops, beloved cafés, and some of the area’s best dining. Charming, stylish, and filled with warmth—this is a place where you can truly feel at home.
Listing Agent
Beach City Brokers Brokerage Phone: 310-989-9044 License #01973078 Listed on: 11/19/2025

Open House Schedule
-
Saturday, November 22, 20251:00 to 3:00 pm11/22/2025 1:00:00 PM +00:0011/22/2025 3:00:00 PM +00:00Add to Calendar
-
Sunday, November 23, 20251:00 to 3:00 pm11/23/2025 1:00:00 PM +00:0011/23/2025 3:00:00 PM +00:00Add to Calendar
Home Details
Home Type
- Single Family
Est. Annual Taxes
- $3,735
Year Built
- Built in 1958
Lot Details
- 5,600 Sq Ft Lot
- Density is up to 1 Unit/Acre
Parking
- 2 Car Garage
Home Design
- Entry on the 1st floor
- Composition Roof
Interior Spaces
- 1,365 Sq Ft Home
- 1-Story Property
- French Doors
- Bluff Views
- Laundry Room
Bedrooms and Bathrooms
- 4 Main Level Bedrooms
- 2 Full Bathrooms
Utilities
- Forced Air Heating System
Community Details
- No Home Owners Association
Listing and Financial Details
- Legal Lot and Block 26 / 30
- Tax Tract Number 4983
- Assessor Parcel Number 7349016026
- $427 per year additional tax assessments
Map
Home Values in the Area
Average Home Value in this Area
Tax History
| Year | Tax Paid | Tax Assessment Tax Assessment Total Assessment is a certain percentage of the fair market value that is determined by local assessors to be the total taxable value of land and additions on the property. | Land | Improvement |
|---|---|---|---|---|
| 2025 | $3,735 | $288,051 | $262,504 | $25,547 |
| 2024 | $3,735 | $282,404 | $257,357 | $25,047 |
| 2023 | $3,663 | $276,867 | $252,311 | $24,556 |
| 2022 | $3,499 | $271,439 | $247,364 | $24,075 |
| 2021 | $3,448 | $266,117 | $242,514 | $23,603 |
| 2019 | $3,346 | $258,225 | $235,322 | $22,903 |
| 2018 | $3,262 | $253,162 | $230,708 | $22,454 |
| 2016 | $3,102 | $243,333 | $221,750 | $21,583 |
| 2015 | $3,054 | $239,679 | $218,420 | $21,259 |
| 2014 | $3,065 | $234,985 | $214,142 | $20,843 |
Property History
| Date | Event | Price | List to Sale | Price per Sq Ft |
|---|---|---|---|---|
| 11/19/2025 11/19/25 | For Sale | $899,000 | -- | $659 / Sq Ft |
Purchase History
| Date | Type | Sale Price | Title Company |
|---|---|---|---|
| Interfamily Deed Transfer | -- | Investors Title | |
| Grant Deed | $195,000 | -- | |
| Interfamily Deed Transfer | -- | First American Title Co |
Mortgage History
| Date | Status | Loan Amount | Loan Type |
|---|---|---|---|
| Open | $160,000 | No Value Available | |
| Closed | $155,000 | No Value Available | |
| Previous Owner | $74,000 | No Value Available |
Source: California Regional Multiple Listing Service (CRMLS)
MLS Number: SB25262077
APN: 7349-016-026
Disclaimer: Certain information contained herein is derived from information provided by parties other than Homes.com. All information provided is deemed reliable, but is not guaranteed to be accurate and should be independently verified.
![]() The multiple listing data appearing on this website, or contained in reports produced therefrom, is owned and copyrighted by California Regional Multiple Listing Service, Inc. ("CRMLS") and is protected by all applicable copyright laws. Information provided is for viewer's personal, non-commercial use and may not be used for any purpose other than to identify prospective properties the viewer may be interested in purchasing. All listing data, including but not limited to square footage and lot size is believed to be accurate, but the listing Agent, listing Broker and CRMLS and its affiliates do not warrant or guarantee such accuracy. The viewer should independently verify the listed data prior to making any decisions based on such information by personal inspection and/or contacting a real estate professional.
The multiple listing data appearing on this website, or contained in reports produced therefrom, is owned and copyrighted by California Regional Multiple Listing Service, Inc. ("CRMLS") and is protected by all applicable copyright laws. Information provided is for viewer's personal, non-commercial use and may not be used for any purpose other than to identify prospective properties the viewer may be interested in purchasing. All listing data, including but not limited to square footage and lot size is believed to be accurate, but the listing Agent, listing Broker and CRMLS and its affiliates do not warrant or guarantee such accuracy. The viewer should independently verify the listed data prior to making any decisions based on such information by personal inspection and/or contacting a real estate professional.
Based on information from California Regional Multiple Listing Service, Inc. and /or other sources. All data, including all measurements and calculations of area, is obtained from various sources and has not been, and will not be, verified by broker or MLS. All information should be independently reviewed and verified for accuracy. Properties may or may not be listed by the office/agent presenting the information
- 21322 Denker Ave
- 1668 W 213th St
- 1654 W 216th St
- 1601 Torrance Blvd
- 20907 Halldale Ave
- 1569 W 218th St
- 21125 Normandie Ave
- 1566 W 208th St
- 21726 Halldale Ave
- 1629 W 208th St
- 1667 W 208th St
- 21611 Normandie Ave
- 1514 W 207th St Unit C
- 1636 W 219th St
- 1281 Cabrillo Ave Unit 303
- 1281 Cabrillo Ave Unit 306
- 0 Del Amo Unit SB25162322
- 1636 W 205th St
- 1534 Marcelina Ave Unit D
- 1534 Marcelina Ave Unit B
- 1607 W 214th St
- 21240 S Western Ave
- 21105 Dalton Ave
- 1555 W Carson St
- 1628 W 218th St
- 1306 W Carson St
- 20712 S Western Ave Unit 1
- 1301 Cabrillo Ave Unit 210
- 1241 Ivy Terrace
- 1646-1652 Cabrillo Ave
- 1616 W 206th St Unit 2
- 20520 1/2 S Western Ave
- 1116 Sartori Ave Unit 105
- 1751 Cabrillo Ave Unit C
- 1414 Cravens Ave
- 1514 W 204th St Unit 1514
- 1652 W 204th St Unit 9
- 1623 Arlington Ave Unit L
- 1623 Arlington Ave Unit E
- 1623 Arlington Ave Unit B